TL;DR
PEPE’s daily chart has triggered two TD Sequential buy signals, according to analyst Ali Martinez. A green “A13” appeared on September 22, followed by a red “9” candle on September 24. Both are widely monitored indicators that traders often associate with a potential pause in selling pressure.
Meanwhile, these signals came after PEPE dropped more than 17% over the last seven days, with the token hitting local lows before recovering slightly to $0.00000969. Martinez remarked,
TD Sequential just flashed two buy signals on $PEPE daily chart! pic.twitter.com/5Ith9GTtCw
— Ali (@ali_charts) September 25, 2025
At the time of writing, PEPE trades at $0.0000094 with a daily turnover of $370 million. The token is down 2% over 24 hours.
Another perspective was shared by analyst Butterfly, who noted PEPE is consolidating within a symmetrical triangle pattern. The price is currently moving near the lower boundary of the formation, which has acted as support on several occasions this year.
Butterfly commented,
“Smart money is loading up. After bulls regain full control, $PEPE has potential to soar toward new highs.”
A breakout above the triangle’s upper line would strengthen bullish expectations, with potential to retest previous swing highs. Until that occurs, PEPE remains in consolidation.
On the 4-hour chart, the Relative Strength Index (RSI) stands at 31, close to the oversold mark of 30. This level suggests that downward momentum may be stretched, increasing the chance of a relief bounce.
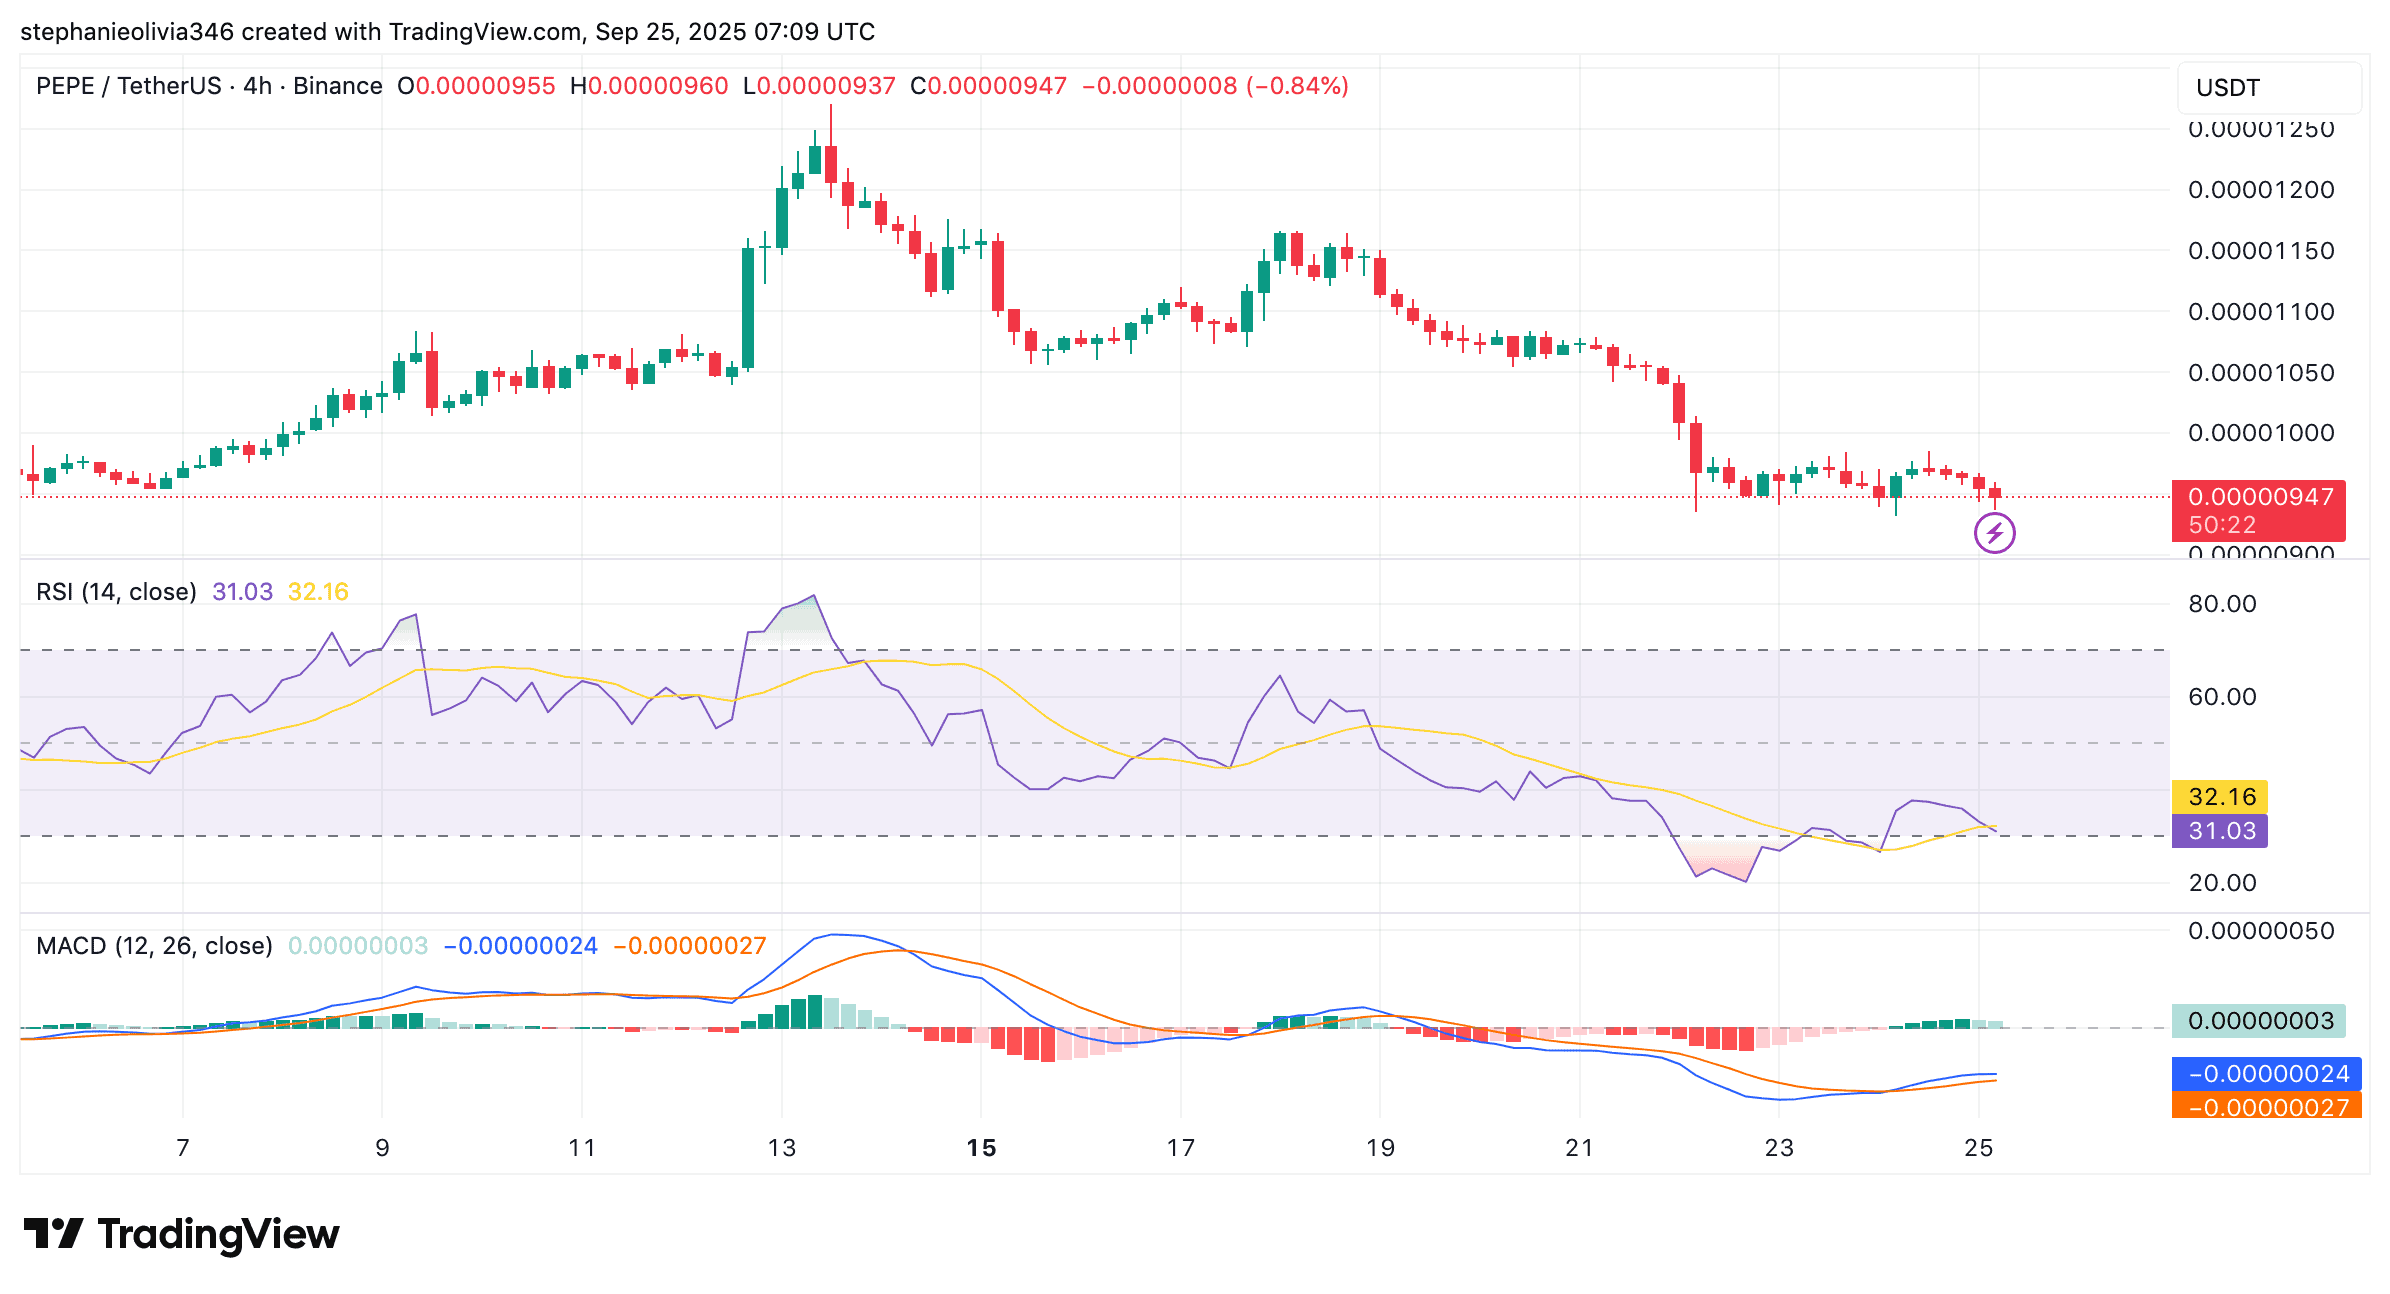
The MACD line is slightly below the signal line, with only a narrow gap separating the two. This shows that downward momentum is slowing. A positive crossover would give further evidence of a rebound attempt.
Additionally, futures market data shows long traders absorbed heavier losses than shorts. On September 25, more than $600,000 in long positions were liquidated, compared with $46,000 in shorts. The largest losses were recorded on OKX and Gate.
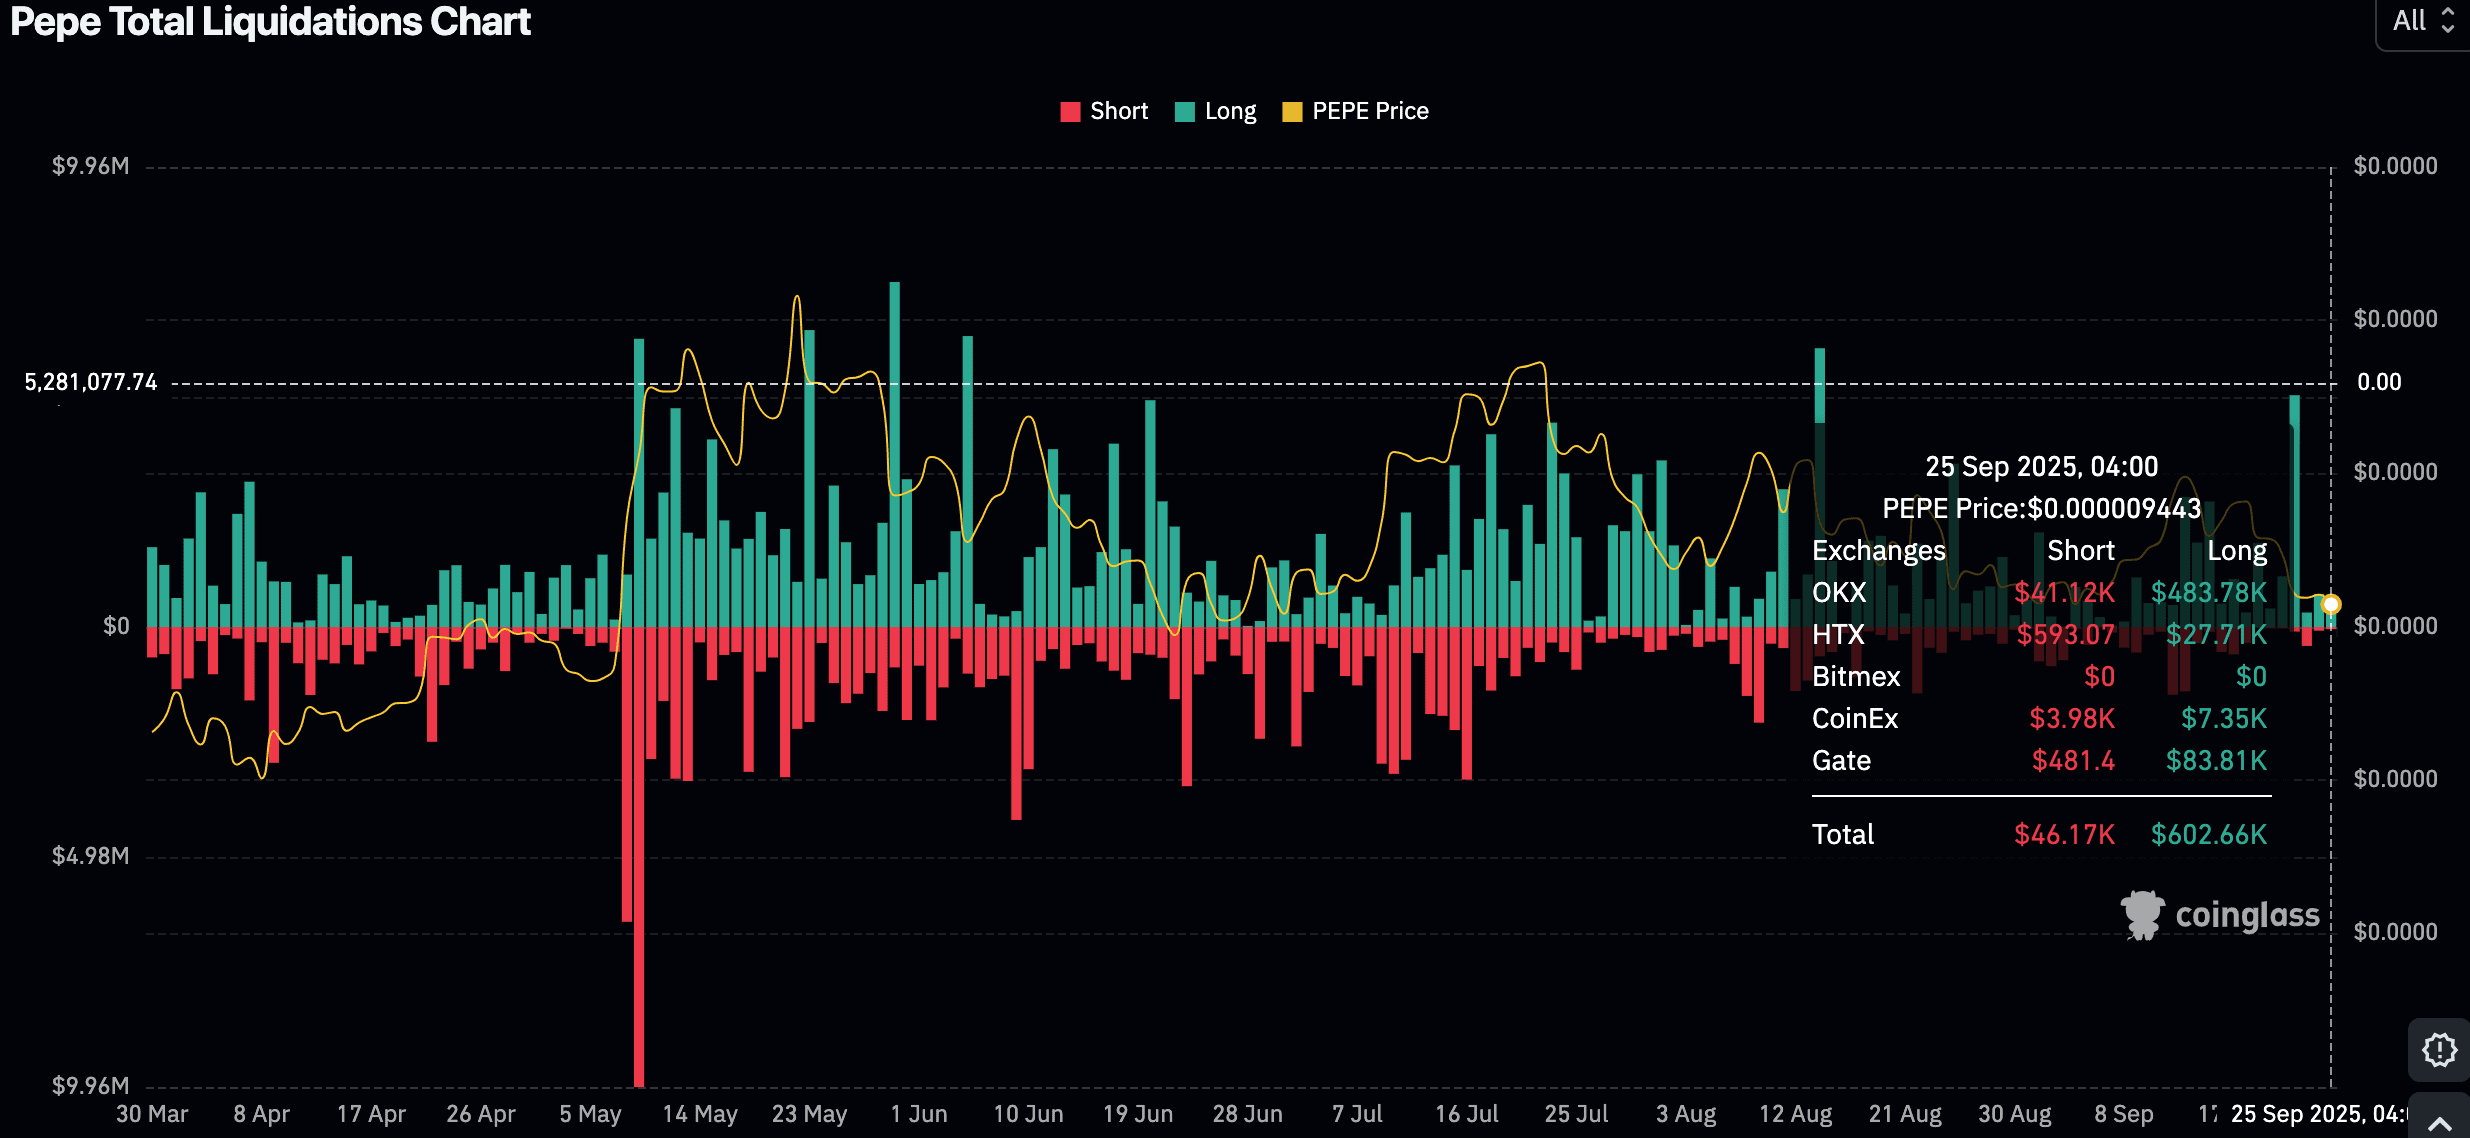
The imbalance suggests that many traders expected a rebound, which failed to hold. Large liquidations of long positions during a downtrend often reflect overextended bullish bets being cleared from the market. Until leverage resets, conditions may stay volatile.
The post PEPE Charts Flash Double Buy Signal After 17% Drop appeared first on CryptoPotato.


