Solana is showing early signs of a possible recovery. Buyers appear to be stepping back into the market after a long stretch of weak price action.
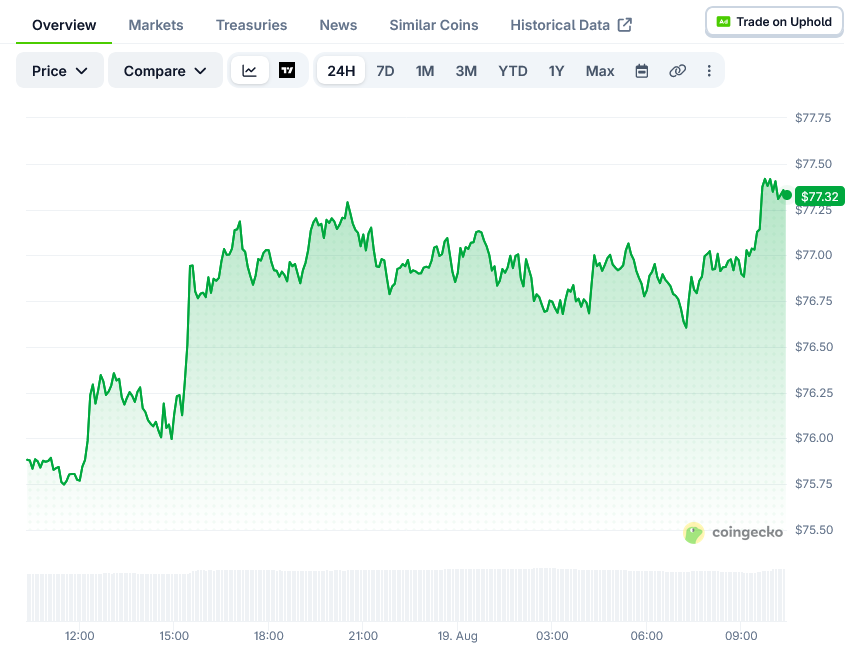
Brave New Coin data puts SOL trading around $76.91. A separate snapshot from the same source shows the price at $75.55, up 0.20% over the past day.
Traders are watching a few technical signals closely right now. Together, they suggest the coin could be building toward a bigger move.
Trader Symba shared a daily chart showing SOL compressed inside a symmetrical triangle. Price is squeezed between a descending trendline and an ascending one, nearing the triangle’s tip.
Something about $SOL is looking really nice
Just get us that RSI breakout and Solana will easily take out that $80 mark. pic.twitter.com/VYBWDxirJu
— Trader Symba (@Nebulabsxyz) August 18, 2026
At the same time, RSI is testing its own resistance trendline. A breakout on both fronts could push short-term momentum higher.
Symba’s chart points to $80 as the next test if that breakout happens. A clean move above it would suggest buyers are starting to take control again.
Another analyst, CRG, flagged a different setup on X. CRG’s chart shows SOL sitting just under its daily Ichimoku cloud, a zone that has acted as a ceiling since late 2025.
A daily close above that cloud would mark a real shift in structure. CRG’s chart frames the $80-$85 area as the first real test after that happens.
If SOL clears it, the chart shows room to run toward $100 first, then further resistance beyond that.
A third trader, CryptoGerla, posted a chart applying Wyckoff theory to SOL’s recent price action. The idea is that Solana may have already worked through accumulation and manipulation phases.
CryptoGerla’s chart suggests the coin could now be entering a markup phase, following a long decline and drawn-out sideways period.
If that markup phase plays out, the chart marks $80 as the first confirmation point. From there, targets move to the $100-$110 range and then up toward $128.
That $128 level lines up with older resistance from earlier in Solana’s price history. It sits well above where SOL trades today.
On the downside, the $70-$72 area is being treated as support. A failure to clear $80-$85 could send SOL back toward that zone instead.
For now, SOL remains below all three of these key markers: the triangle apex, the RSI trendline, and the daily cloud. Each one needs to break in the coin’s favor for the recovery case to hold up.
Price action over the next few sessions should show whether buyers can push through the $80-$85 wall. As of the latest data, SOL sits at $75.55, up 0.20% on the day.
The post Solana (SOL) Price: What the $80 Resistance Zone Means for Traders appeared first on Blockonomi.





