
Liquidity zones and liquidity voids are important concepts for traders seeking to understand market structure and price dynamics. Price does not move randomly—it gravitates towards areas where liquidity is concentrated and reacts sharply when liquidity is absent. Liquidity zones and liquidity voids reveal the hidden footprints of institutional activity. Understanding them may help traders analyse market movements. This article uncovers how liquidity zones and liquidity voids function in market structure and shows their role on real-time price charts.
In trading, liquidity refers to the potential ease with which an asset can be bought or sold in the market without causing significant price changes. High liquidity means that there are enough buyers and sellers at any given price level, facilitating potentially smoother and more consistent transactions. This concept is critical because it affects how quickly and at what price a trader can enter or exit positions.
Assets with high liquidity tend to have tighter spreads between the buy and sell prices, potentially reducing the cost of trading. Conversely, assets with low liquidity can experience abrupt price movements due to the lack of a steady flow of orders. Understanding the liquidity of an asset may help traders make trading decisions and implement risk management.
These dynamics give rise to two important phenomena in trading: liquidity zones and voids. Liquidity zones are areas with a high concentration of trading activity, while liquidity voids represent gaps in the market where trading activity is sparse, each presenting unique conditions for trading strategies.
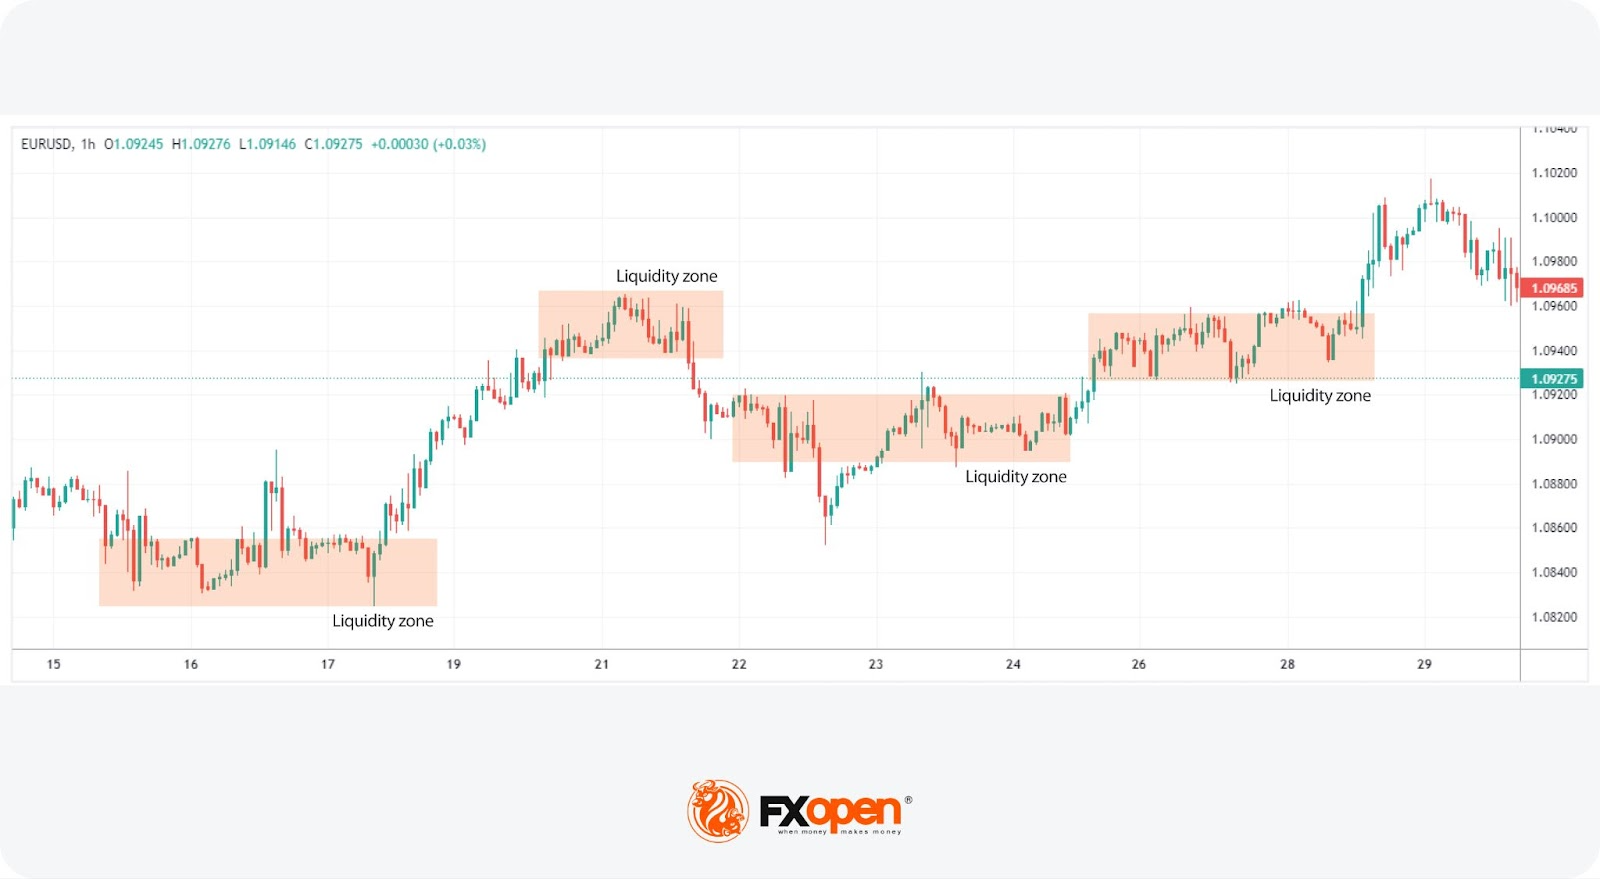
Liquidity zones, sometimes known as liquidity levels, are specific areas on a price chart characterised by a significant concentration of trading activity, leading to elevated volumes of buy and sell orders. These zones may be helpful for traders as they indicate areas where the asset's liquidity is expected to be higher, making it potentially easier to execute large orders with minimal impact on price.
In the context of currency trading, forex liquidity zones can indicate areas where currency pairs tend to see higher activity, which may provide traders with potential reference points for entries and exits. They may also be useful areas to watch for reversals or breakouts.
The formation of these zones is often tied to historical price levels where the asset has previously seen considerable trading activity. They often serve as magnets for future trading, attracting more buy and sell orders due to traders' anticipation of potential price movements around these areas.
Liquidity levels are commonly associated with support and resistance levels in technical analysis. When a price approaches a level, traders can expect increased order flow, leading to smoother price movements and potentially clearer signals for trading decisions.
Liquidity zone trading hinges on the accurate identification of areas on the chart where trading activity is significantly concentrated. These levels not only highlight regions of high volume but also reflect potential pivot points for price action. Here's a closer look at three techniques for identifying liquidity zones.
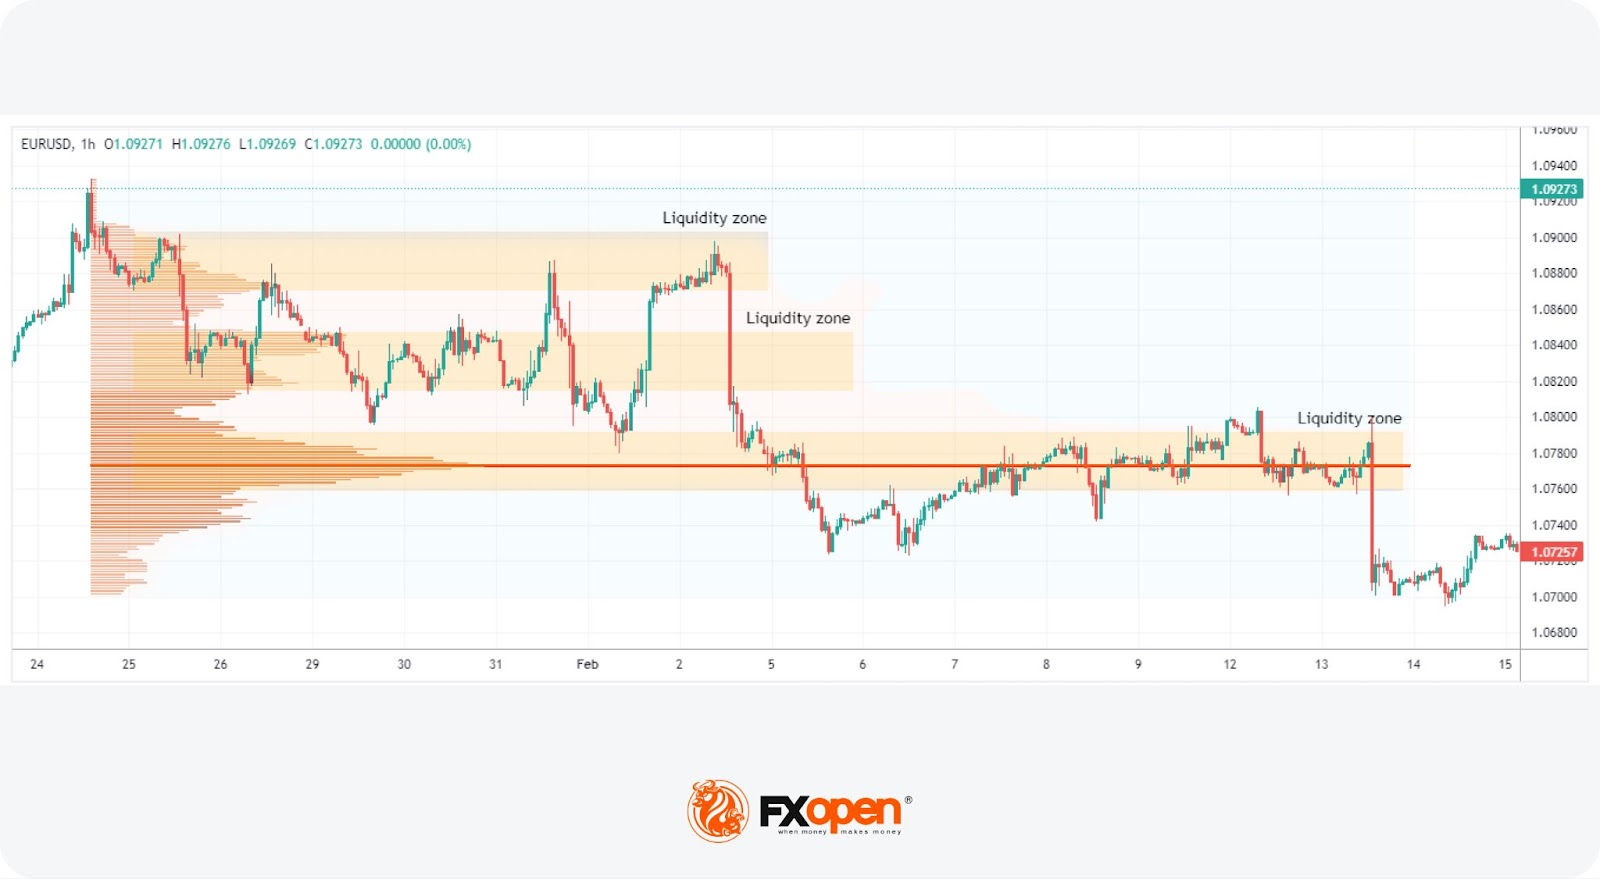
This approach leverages the volume profile to map out where the bulk of trading activity has taken place. Unlike traditional volume indicators that display volume over time, the volume profile presents it across different price levels. This may help traders identify levels where the volume peaks, pointing towards areas of significant liquidity.
To use the volume profile tool as we have in the picture above, you can head over to FXOpen’s TickTrader trading platform and search for “Volume Profile Fixed Range” under the Indicators tab.
Recognising zones where the price has consolidated for a notable period is another method. These areas represent a tug-of-war between buyers and sellers, resulting in a high volume of trades. Such levels often act as magnets for future price action, making them critical for liquidity area trading.
Historical support and resistance levels are invaluable for spotting zones. These are levels at which significant reversals or pauses in trend have occurred, indicating areas where large volumes of orders may accumulate. When price approaches these levels again, it often does so with increased trading activity, making them prime candidates for liquidity areas.
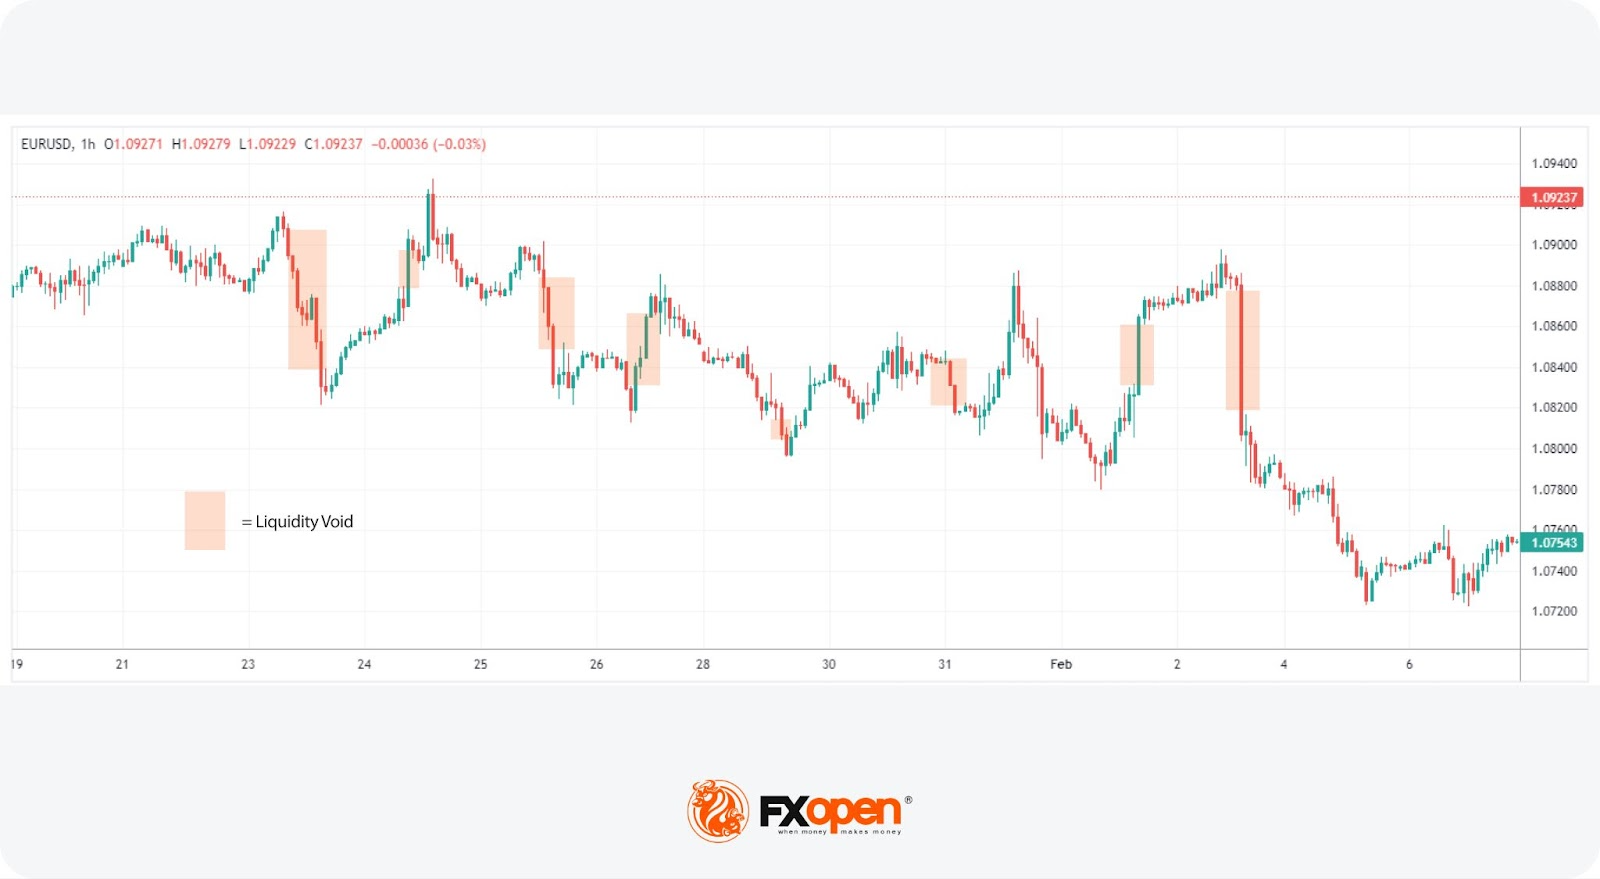
Liquidity voids, sometimes known as an imbalance, represent significant moments in the forex market, marked by rapid price movements between two levels without the typical intermediary trading activity. These gaps in liquidity can lead to abrupt changes in price, often visualised as large jumps on a chart, which can have profound impacts on trading strategies and market analysis.
A liquidity void in forex signals a temporary absence of balance between buyers and sellers, resulting in a sharp move as the market seeks to find equilibrium at a new price level. This phenomenon often occurs after major news releases, during off-market hours, or as a result of large institutional trades that can move the market significantly with a single order.
The impact of voids extends beyond their immediate appearance on a chart; they represent areas where the market has not established a consensus on price, potentially leading to increased volatility as the market later attempts to "fill" these voids. The concept of moving back to fill an imbalance is rooted in the idea that prices eventually return to levels where previously unmet trade orders exist, seeking to balance the earlier absence of trading activity.
Traders must navigate the increased volatility and unpredictability associated with these gaps but can also strategise to take advantage of the potential return to equilibrium.
Liquidity voids in the forex market manifest in various forms, each with distinct characteristics and implications for traders. Understanding the different types of voids may support traders in navigating these challenging areas. Some notable types of liquidity voids are common, exhaustion, breakout, and runaway. Let’s take a look at them:
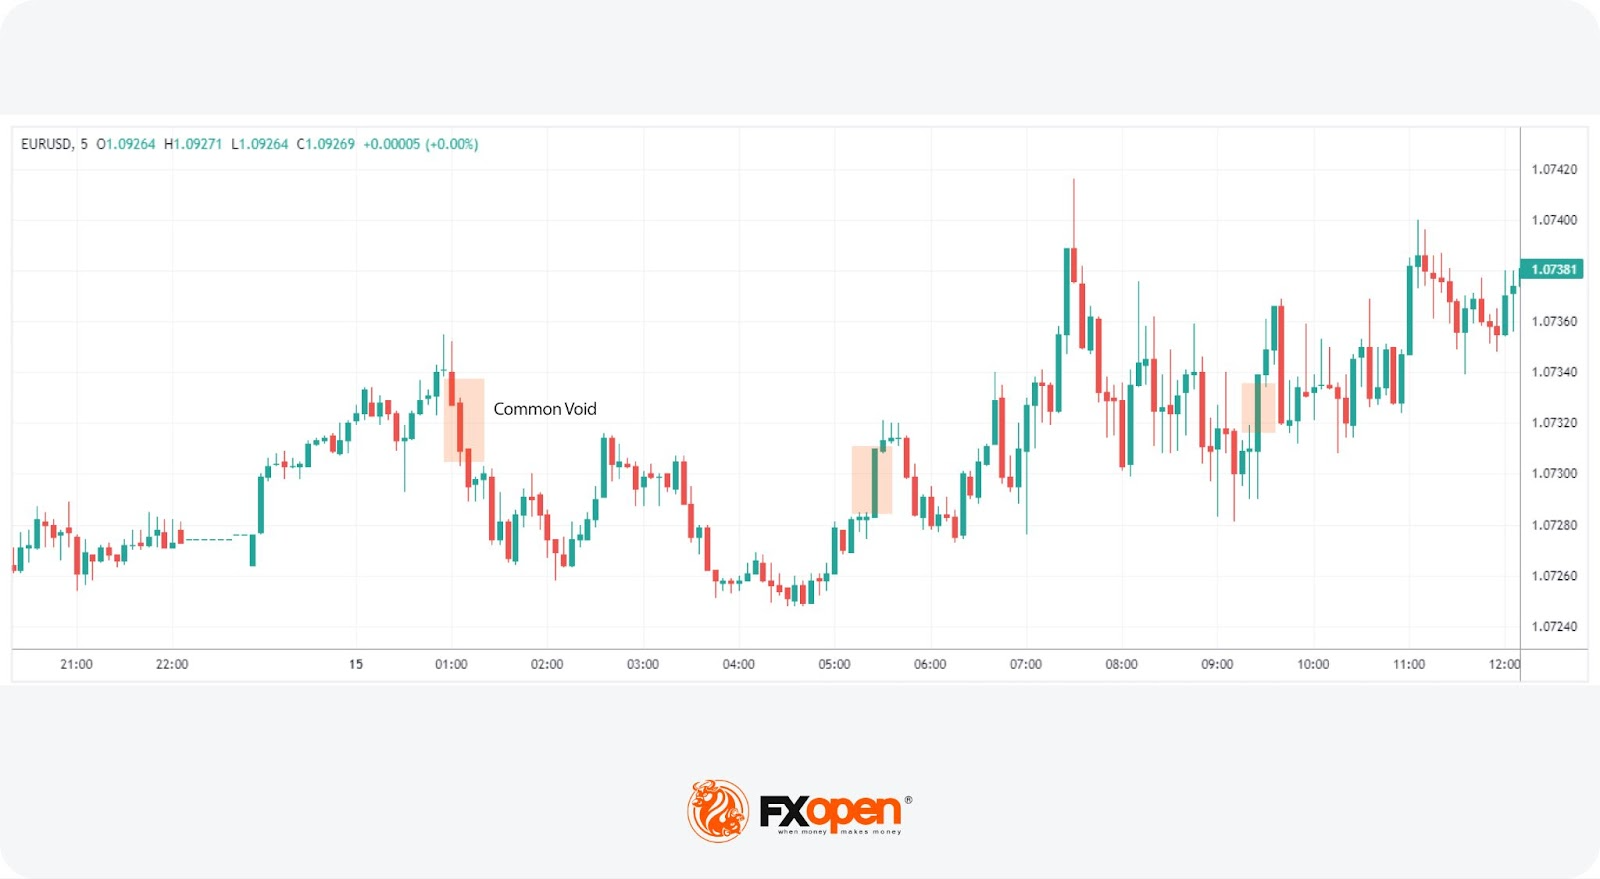
These are the most frequently encountered liquidity voids, appearing randomly across the forex chart without any apparent trigger from market news or events. They appear typically due to the natural market ebb and flow. Common voids may not always carry significant insights but should be navigated carefully to manage risk.
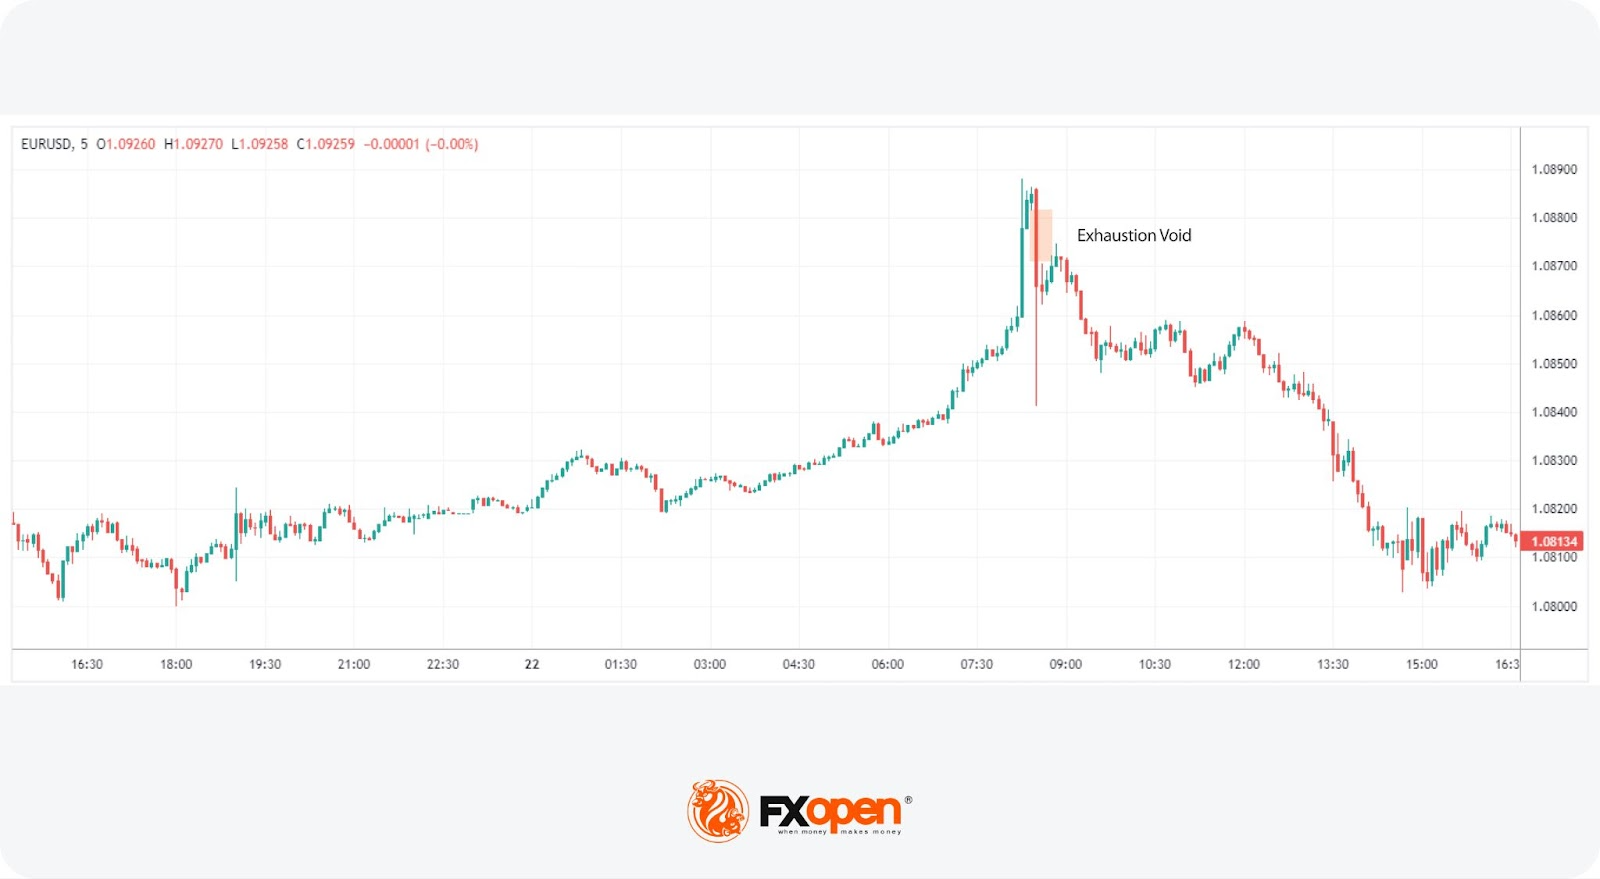
These imbalances appear at the end of a trend and signal a potential reversal. They occur when the momentum starts to wane, and the price makes a final push before reversing direction. Exhaustion voids are particularly noteworthy because they often indicate the end of a market move, providing strategic entry or exit points for traders who can identify them early.
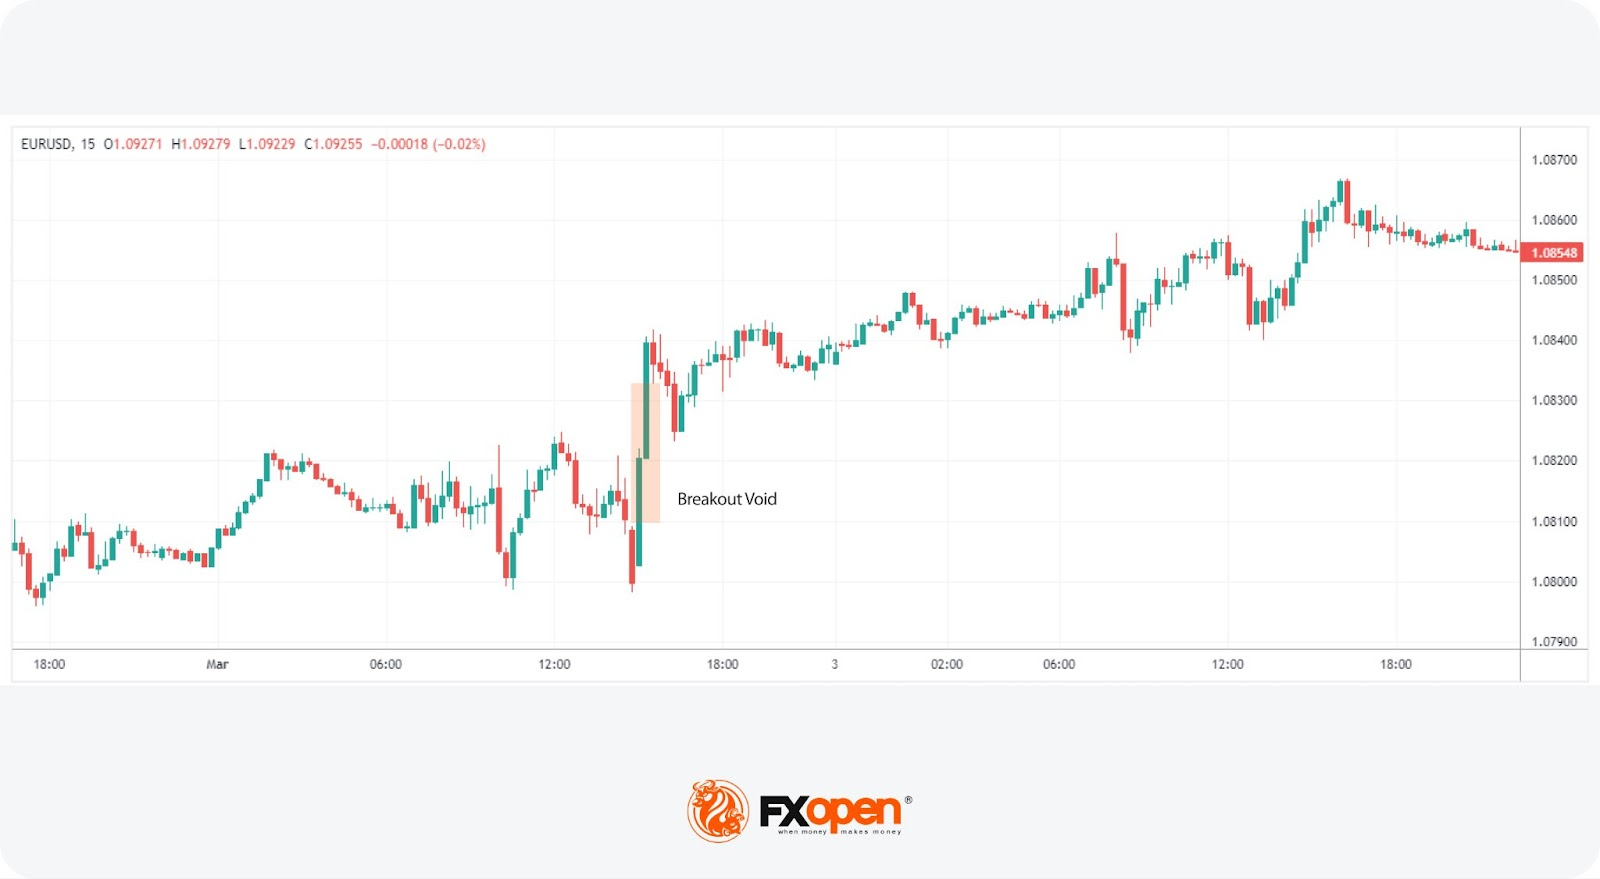
Characterised by a sudden price movement out of a range or through a significant level of support or resistance, breakout voids can signal the beginning of a new trend. They are formed when the price action breaks through a key level with enough force to leave behind an imbalance. This type of void may be useful for traders who catch the breakout early.
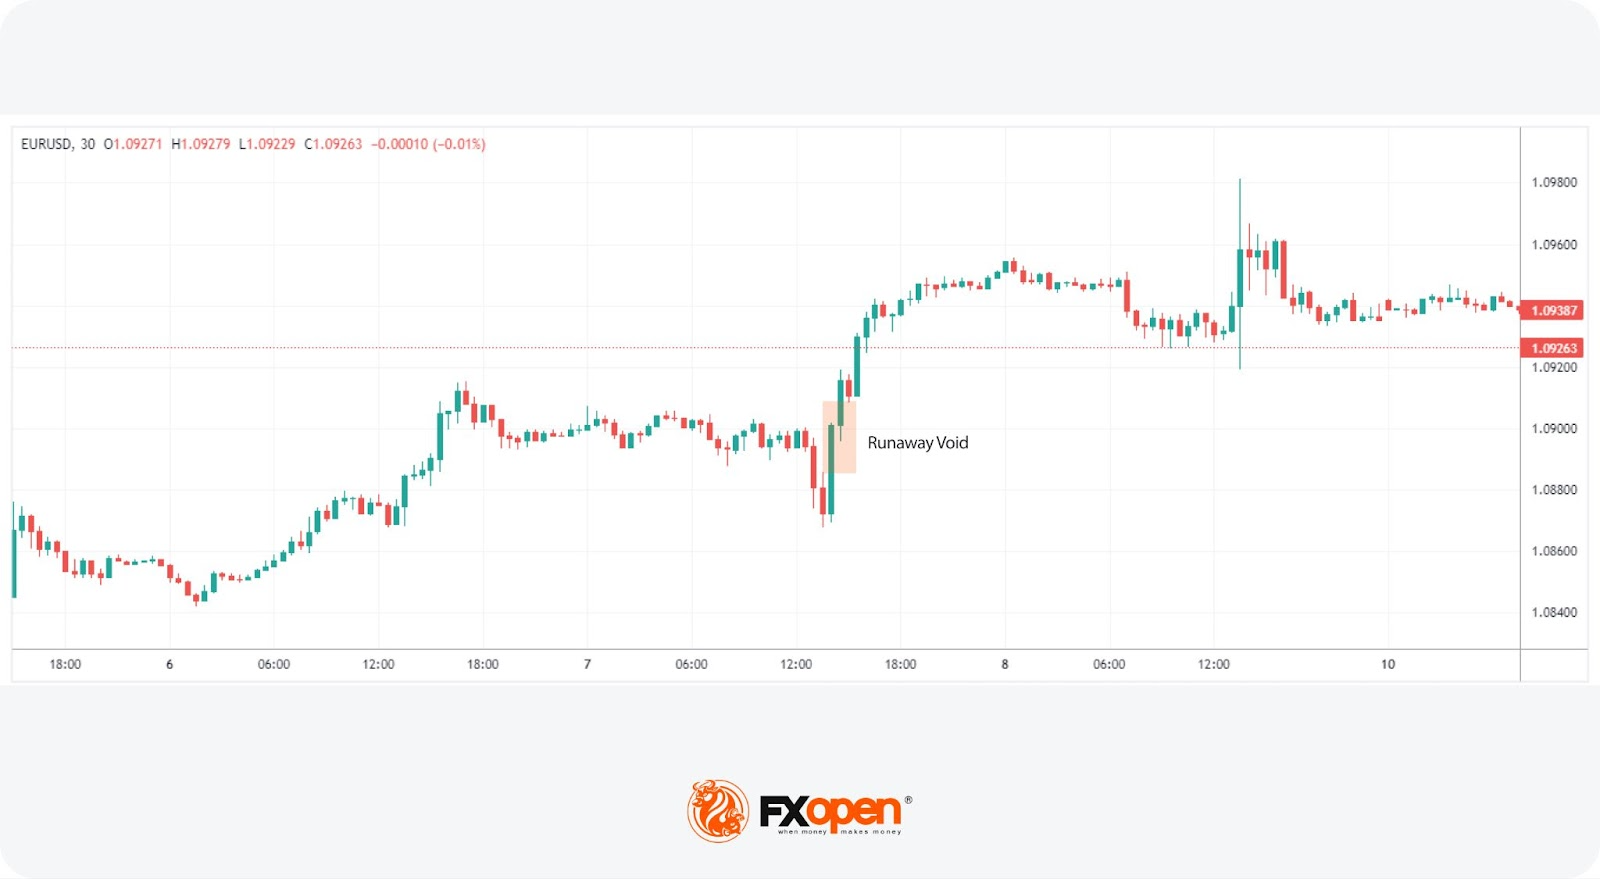
These occur within an existing trend and signify its continuation. Runaway voids appear as the market makes a significant move in the direction of the trend, bypassing levels where liquidity might have been expected. Identifying these voids may support traders in confirming the strength and sustainability of a trend.
Utilising zones and voids may support traders in market analysis, offering insights into potential future market movements and reversal points.
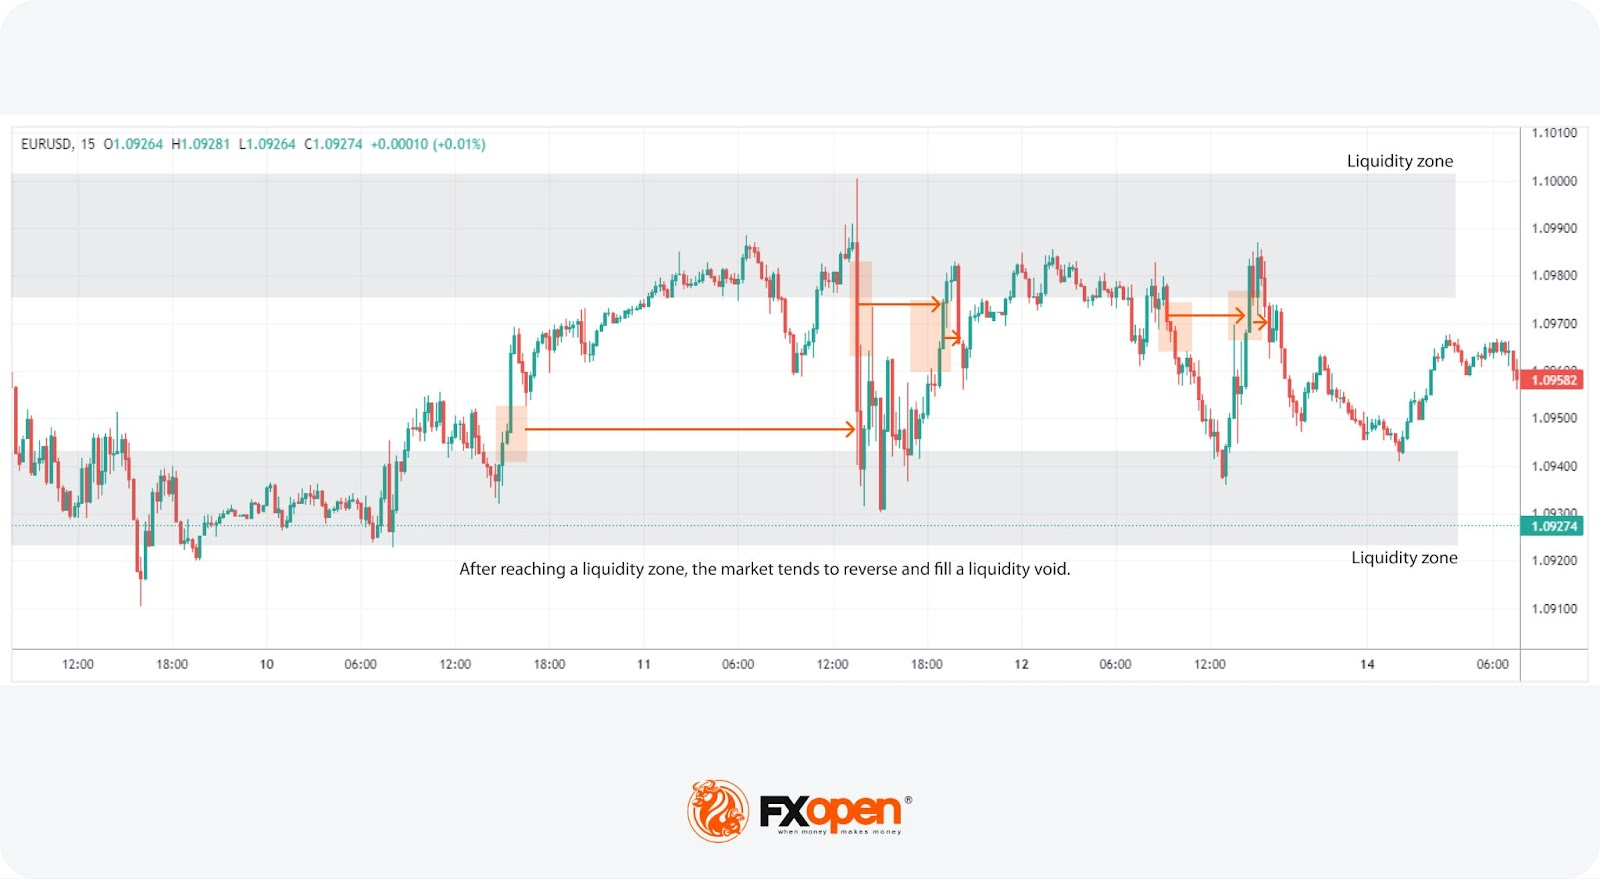
Liquidity zones, rich with trading activity, act as magnets attracting the price towards them. Traders closely watch these areas not only for placing orders but also for setting a bias over time. The inherent magnet-like properties of these levels reflect areas where the price is likely to move, providing a strategic advantage in anticipating market direction.
On the other hand, liquidity voids reveal the market’s natural tendency to return and “fill” inefficiencies. The knowledge that prices are likely to return to these imbalances enables traders to anticipate and capitalise on potential price movements as these voids are addressed. When combined, the concepts of zones and voids offer a lens through which price action can be analysed.
For instance, when the price reaches a liquidity area, it may signal the market's attempt to fill a nearby imbalance that remains untraded. This interaction between the zone's magnetic pull and the void's filling potential can inform strategic trade placements and expectations about trend reversals or continuations.
While it may not be feasible to base an entire trading strategy on these concepts alone, integrating the analysis of liquidity zones and voids into a broader trading plan can offer valuable insights. This integration may help identify where the market might head next and pinpoint probable reversal areas, supporting traders when making trading decisions.
Understanding liquidity zones and voids provides traders with valuable insights into market dynamics, yet relying solely on these concepts comes with limitations. Here are some specific challenges to consider:
Understanding liquidity zones and voids can be a critical skill for navigating the forex market. These concepts reveal notable areas of market activity, offering insights into potential price movements. However, incorporating them into a broader trading strategy with other market analysis tools is crucial due to their inherent limitations.
For traders seeking to apply these insights, opening an FXOpen account could provide a practical platform to explore and leverage the dynamics of liquidity in their trading across hundreds of tradable assets.
Liquidity zones are specific areas on a trading chart characterised by a high concentration of trading activity, making them critical points for market entry and exit. These areas indicate where significant buying and selling have occurred, reflecting areas of strong support or resistance. They may help traders determine market direction and take advantage of areas of high liquidity.
Liquidity zones can be identified using several methods, including volume profile analysis, observing areas of price consolidation, and examining historical support and resistance levels. These techniques may support traders in spotting areas where trading activity is concentrated, offering insights into potential entry and exit points.
Trading liquidity zones involves monitoring these areas for signs of price potential stability or movement. Traders can use liquidity levels to set strategic entry and exit points, leveraging the high volume of trades to minimise slippage. Additionally, understanding the relationship between liquidity zones and voids may help traders determine market movements and adjust their strategies accordingly.
Liquidity voids are areas in the market where trading activity is sparse or absent, leading to abrupt price movements between two levels. They occur due to an imbalance in buy and sell orders, often following significant news events or during off-market hours, which can trigger rapid price adjustments to new levels.


