The hanging man candlestick is a single-bar pattern that forms after an uptrend. It consists of a small body near the top and a long lower shadow. It points to a possible bearish reversal. Most traders wait for a confirmation candle before acting.
In the world of technical analysis, candlestick patterns are commonly used to decipher market trends and potential reversals. Among the many setups, the hanging man holds particular significance. This distinctive formation captures traders' attention as it often serves as a warning sign of a possible trend reversal. This article will go through the technical analysis of the hanging man formation and explain how traders can trade with it.
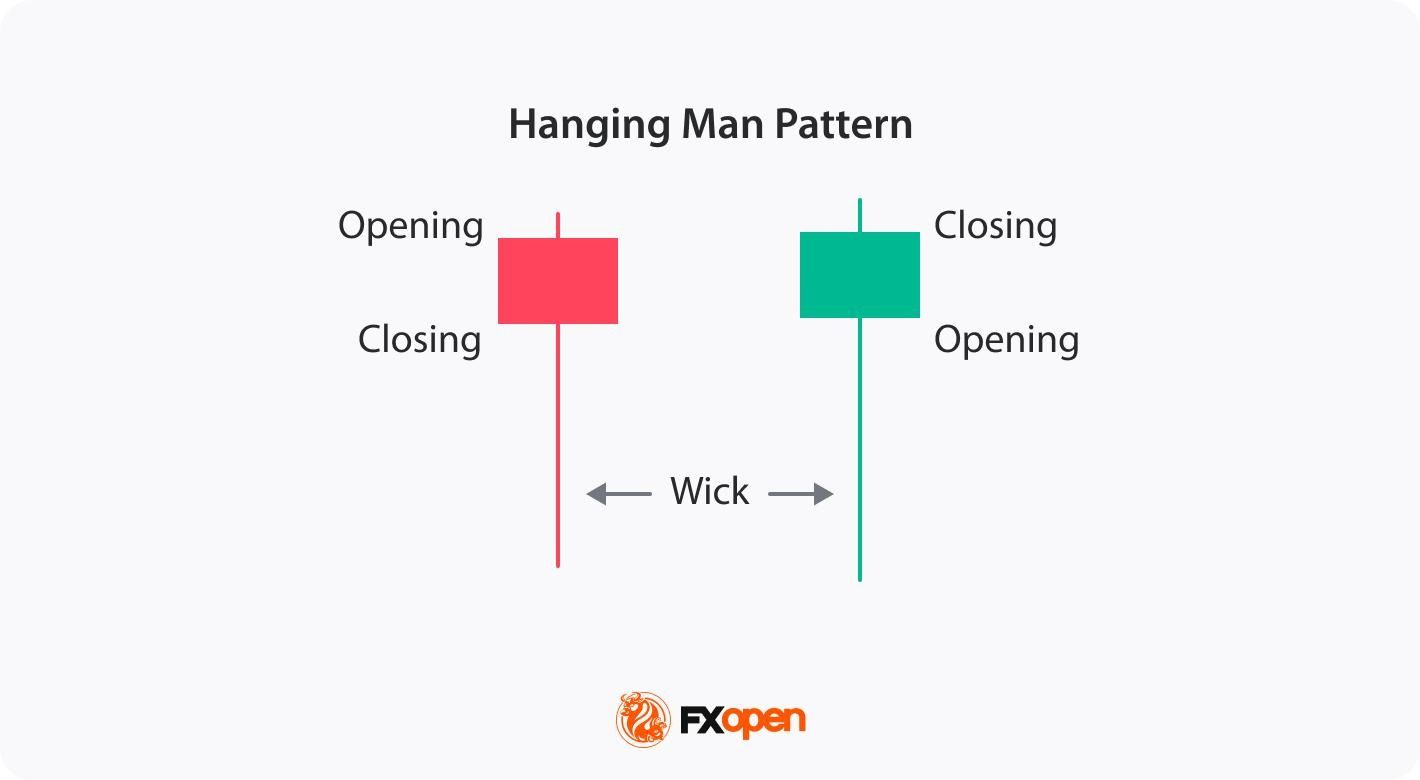
A hanging man candle is a single-bar pattern that forms after an uptrend and warns of a possible bearish reversal. It has a small real body near the top, a long lower shadow, and little or no upper shadow. The colour of the body is secondary, though a bearish close adds weight.
The psychology behind the hanging man candlestick pattern reflects a shift in market sentiment. Buyer exhaustion sits at the core of the hanging man pattern. After a long advance, demand thins and fewer buyers step in at higher prices. Sellers then emerge and drive the long lower shadow, signalling a possible uptrend reversal.
The long lower shadow shows that sellers were able to push prices down significantly during the trading session. Although buyers managed to drive prices back up, the close near the open price suggests weakening bullish sentiment. This pattern signals that seller pressure is increasing, potentially leading to a bearish reversal as confidence among buyers diminishes.
The hanging man is a versatile formation that can be applied across a wide range of financial instruments, including stocks, indices, commodities, and forex, on different timeframes.
A hanging man candle has a clear shape that sets it apart on a chart. Five features define it. Each one matters, and the pattern carries more weight when all five line up after a strong uptrend.
Without a prior uptrend, the same shape is read as a hammer rather than a hanging man candlestick. Context, not colour, gives the candle its meaning.
To spot a hanging man pattern in stocks and other financial instruments, you may follow these steps:
Even with all five checks met, the hanging man candlestick still needs a confirmation candle before it carries weight. The pattern is a warning, not a trigger.
A hanging man confirmation candle is the bearish bar that follows the pattern and provides the candlestick confirmation that validates the reversal. Without it, the hanging man is only a warning. Traders typically watch for one of three signals in their candlestick chart analysis.
The first is a bearish engulfing candle that fully covers the prior body. The second is a strong bearish close well below the hanging man's real body. The third is a clean break below the hanging man's low. Each shows that sellers have taken control after the initial warning. The stronger the confirmation, the more weight the signal tends to carry.
Those trading the hanging man reversal pattern apply a systematic approach. Here are a few steps traders usually follow to trade this pattern:
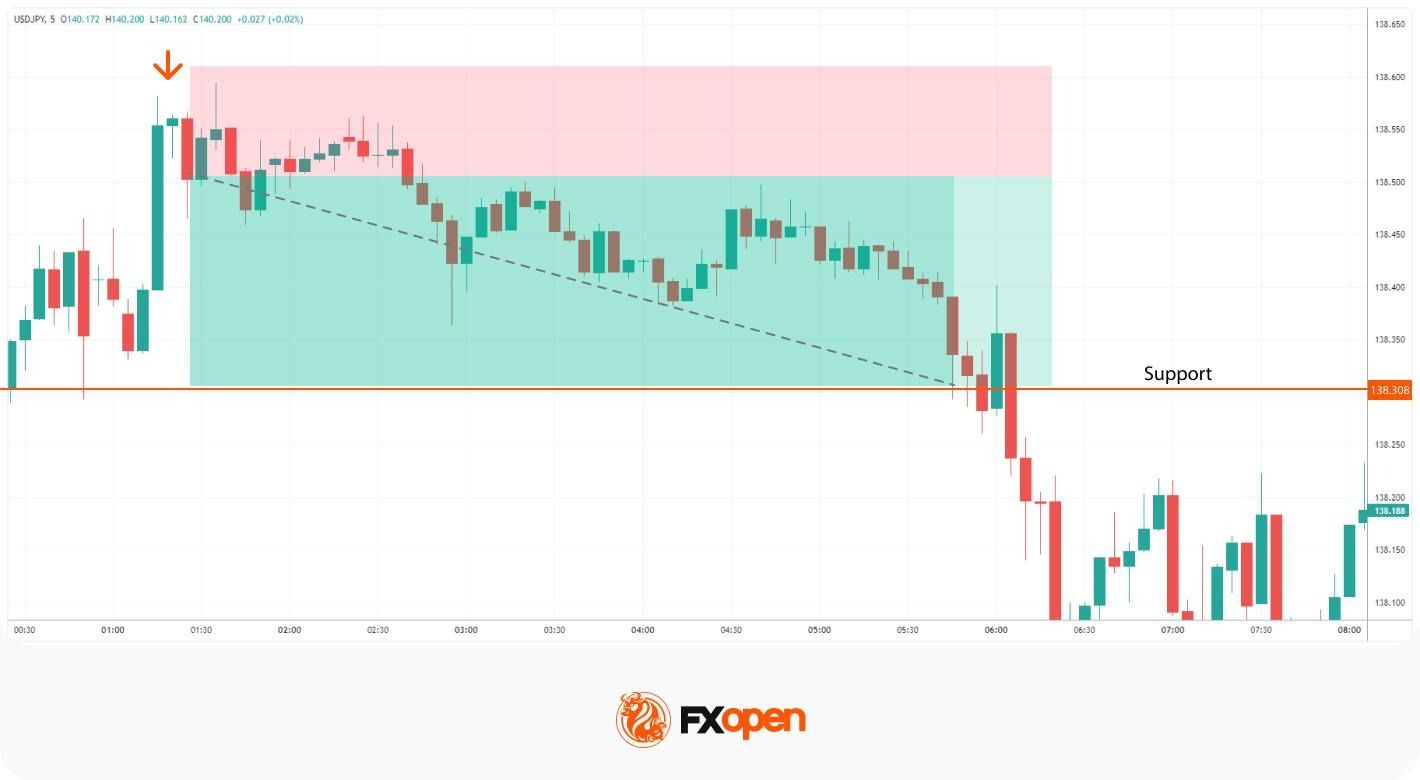
Consider a hanging man that forms on the USD/JPY pair after a steady uptrend. The candle has a small body near the top and a long lower shadow. A bearish candle follows and closes lower, which validates the setup.
A common approach places the stop loss just above the high of the hanging man, since a move back above it would weaken the bearish case. The take profit order is at the next level of support. The gap between entry and that support sets the risk-reward ratio for the trade.
Traders can consider using the TickTrader platform to test the hanging man pattern rules.
The hanging man candlestick pattern, while useful, has certain limitations that traders need to consider:
Context does most of the work here. The pattern flags a possibility, not a certainty.
Understanding how the hanging man pattern differs from similar candlestick patterns may help in accurate technical analysis.
Several single-candle formations look almost identical to it, which makes them easy to confuse. The difference comes down to three things: the trend the candle forms in, where the body and shadow sit, and the signal it gives. The three comparisons below break it down against the hammer, the pin bar, and the shooting star.
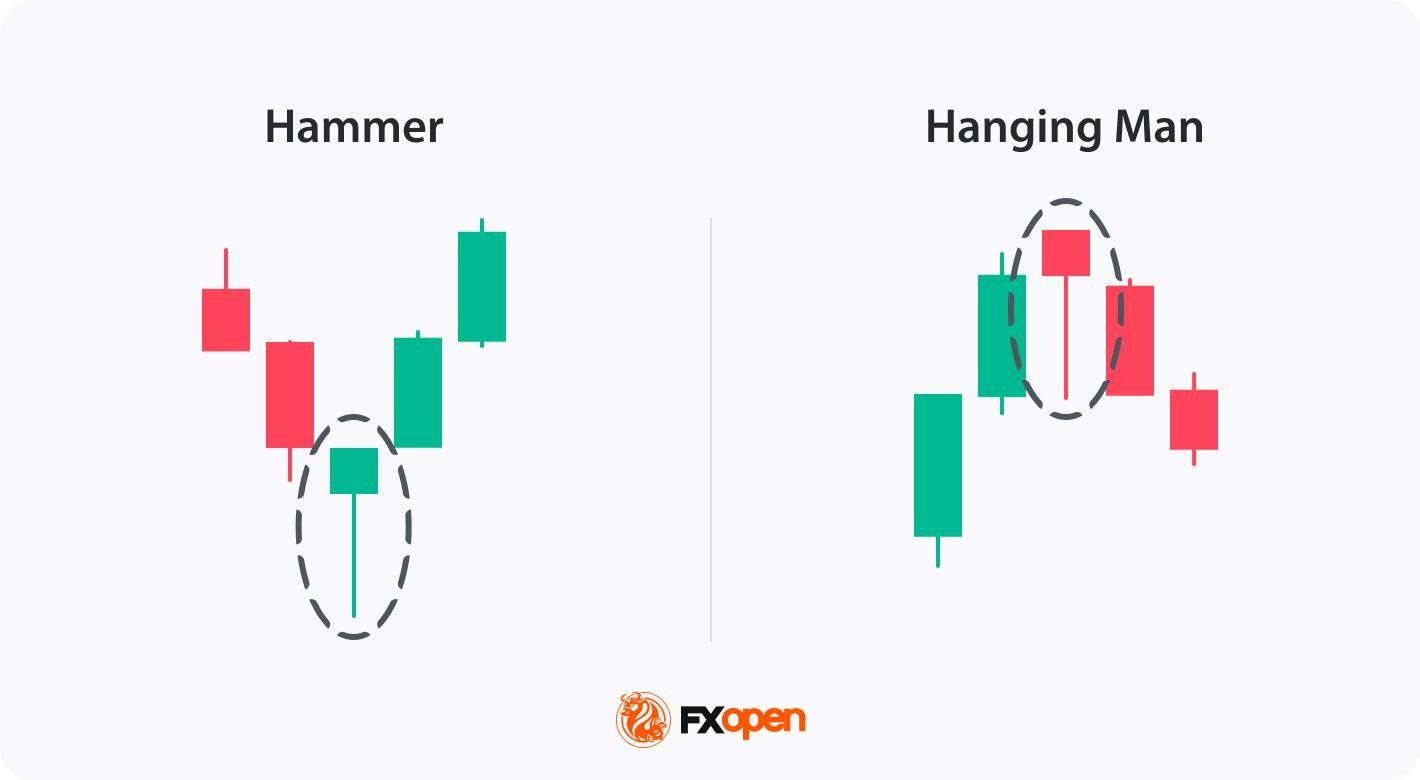
Both candles share the same structure: a small body near the top and a long lower shadow. The hanging man vs hammer difference comes down to the trend each one forms in.
The hanging man candlestick forms in an uptrend and signals a potential bearish reversal, while the hammer appears in a downtrend, indicating a potential bullish reversal. Both candles require confirmation from subsequent price movements. They are typically analysed within the context of the overall market trend and other technical indicators.
Hanging Man | Hammer | |
Trend | Uptrend | Downtrend |
Signal | Bearish reversal | Bullish reversal |
Location | Top of a move | Bottom of a move |
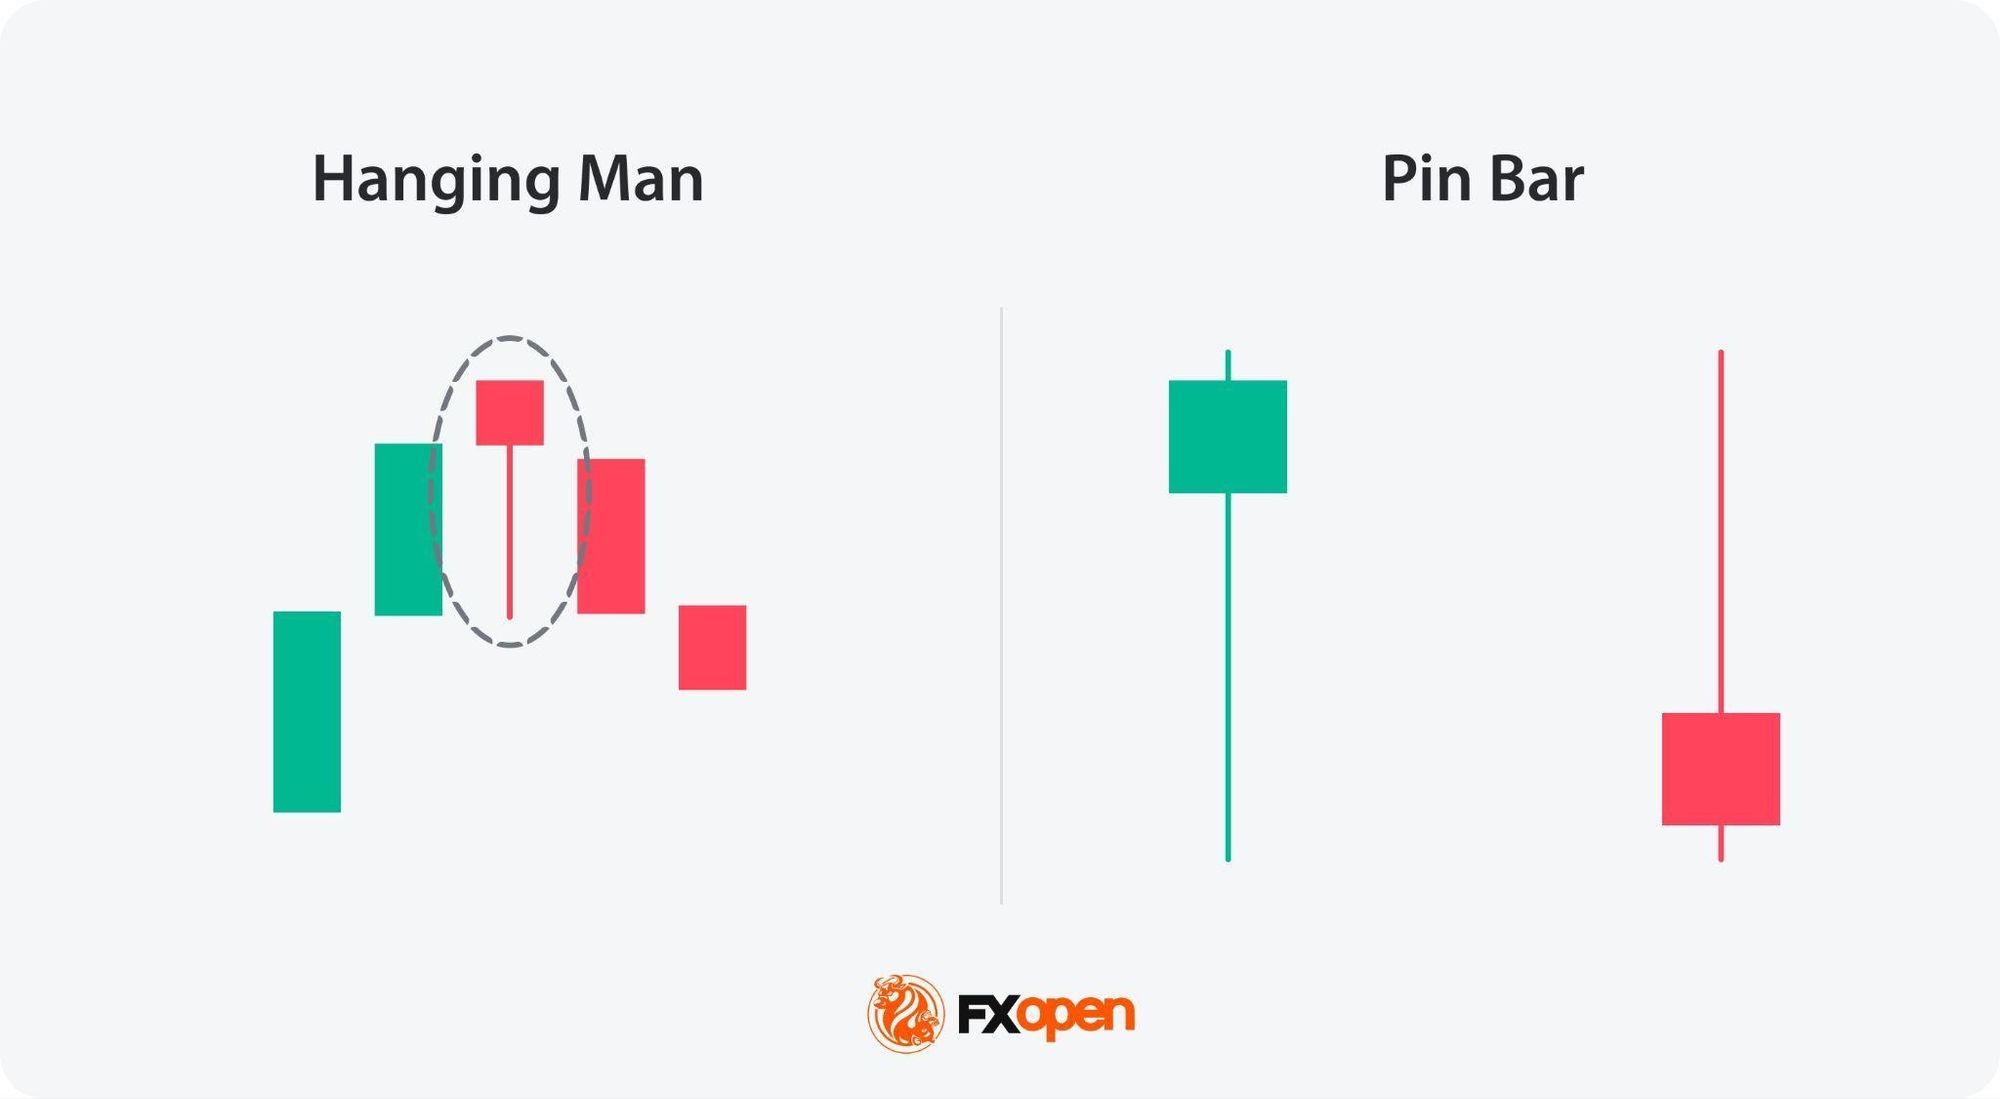
A pin bar and a hanging man are both single-candlestick patterns with small bodies and long shadows, but they serve different purposes in price action trading. The pin bar has a small body and a long tail, indicating a reversal, but it can appear in bullish and bearish markets. In a bullish trend, it’s called a shooting star, it has a long upper shadow and a small body, and signals a downward reversal. In a bearish trend, it’s called a hammer, it has a long lower shadow and a small body, and signals a bullish reversal. Its long tail shows a strong rejection of a certain price level, with the body pointing in the direction of the anticipated reversal.
The hanging man, however, specifically occurs after an uptrend and signals a potential bearish reversal, characterised by a small body at the top and a long lower shadow, indicating selling pressure.
Hanging Man | Pin Bar | |
Trend | Uptrend only | Any trend |
Signal | Bearish reversal | Reversal, either direction |
Location | Top of an uptrend | At a rejected price level |
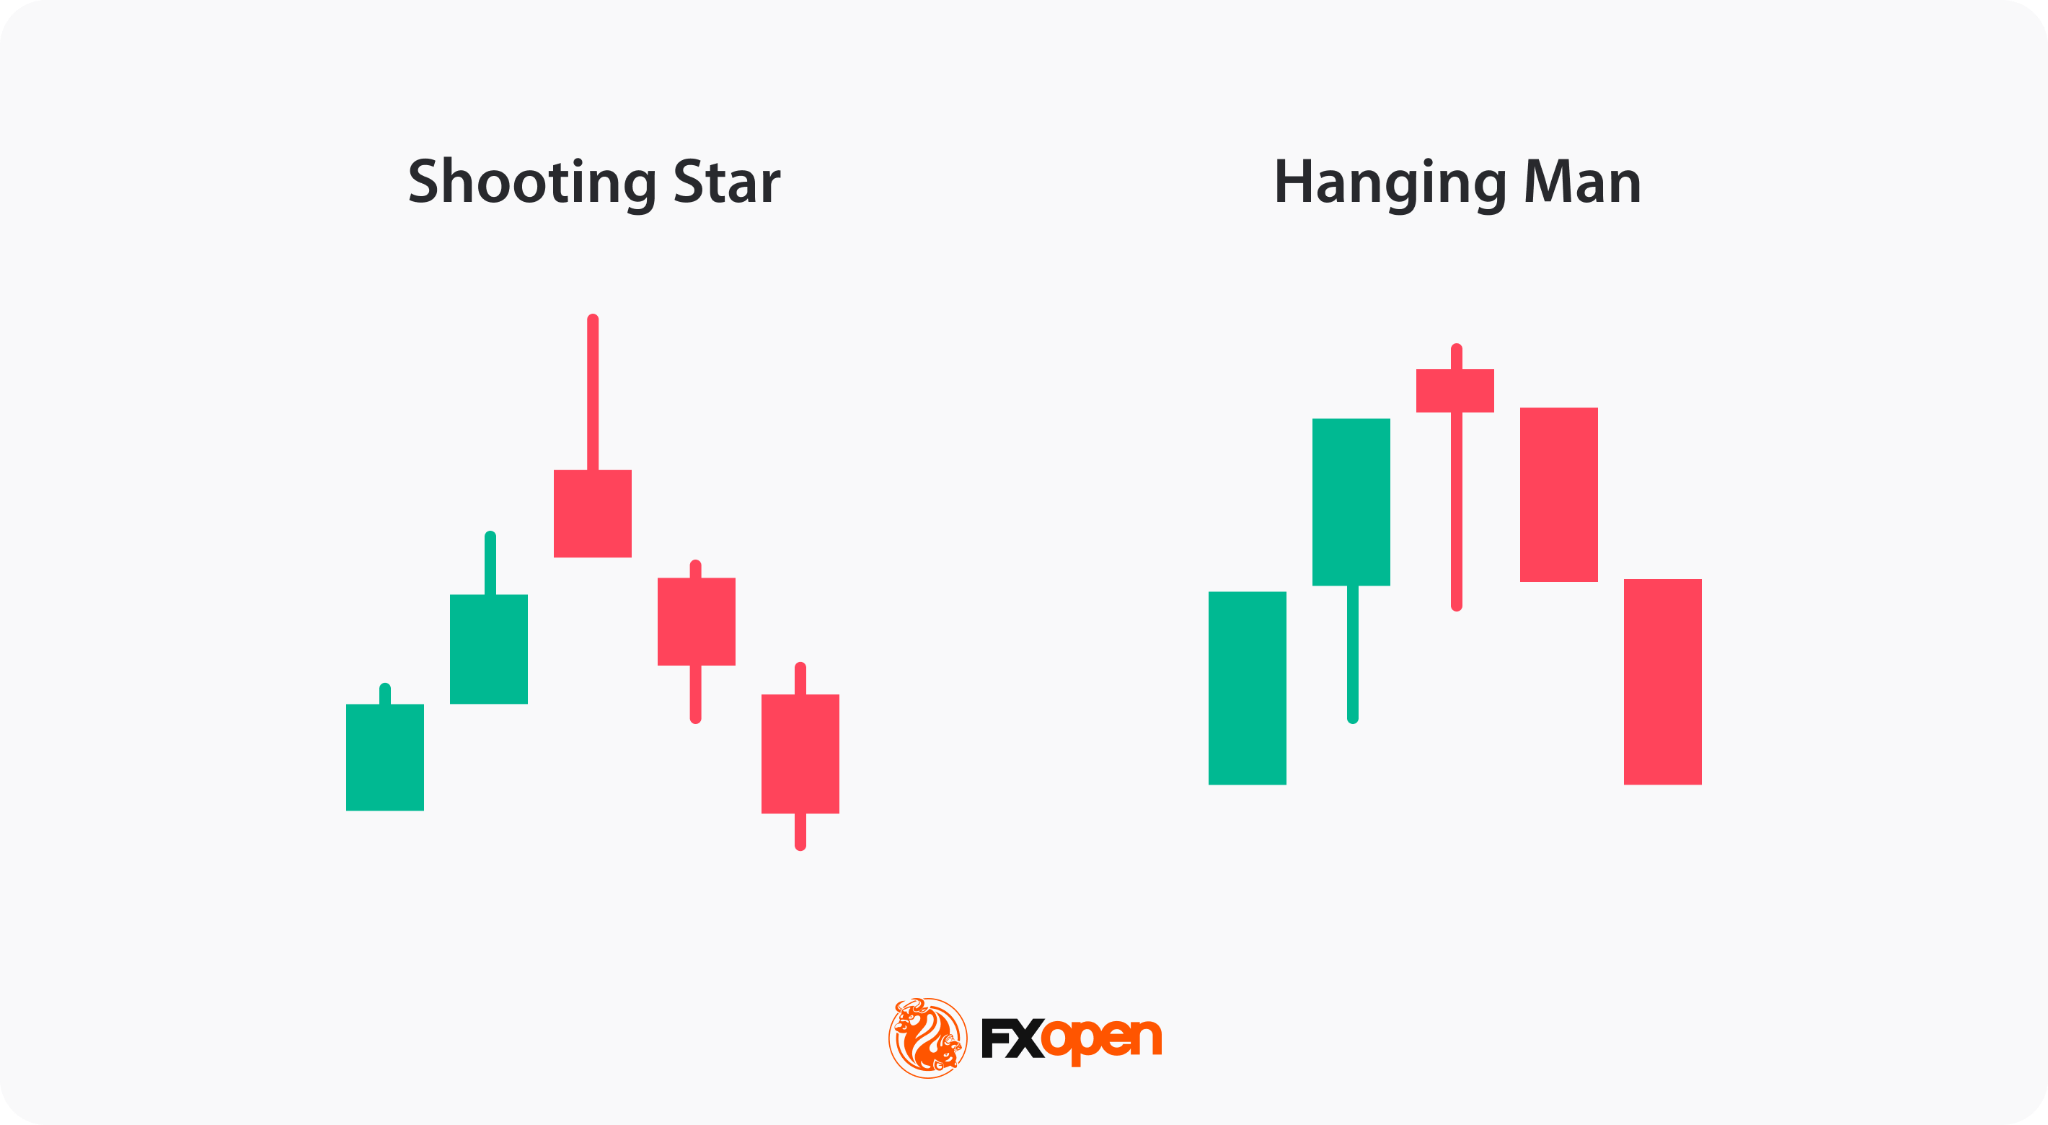
The shooting star and the hanging man are both bearish reversal patterns, but they differ in their appearance and context. A shooting star occurs after an uptrend and features a small body at the bottom with a long upper shadow. It indicates that the price was pushed up significantly but fell back down, showing strong selling pressure.
The hanging man also appears after an uptrend but has a small body at the top with a long lower shadow. It suggests that sellers dominated the session despite an initial push by buyers.
Both require confirmation from subsequent candlesticks to validate the reversal.
Hanging Man | Shooting Star | |
Trend | Uptrend | Uptrend |
Signal | Bearish reversal | Bearish reversal |
Location | Body at top, long lower shadow | Body at bottom, long upper shadow |
On its own, the hanging man is a moderate signal. Its reliability depends on what surrounds it, not the candle alone. Four factors decide how much weight it carries.
Market context matters first. The pattern means little without a clear, sustained uptrend behind it. The same shape inside a choppy range carries almost no signal.
Trading confirmation comes next. A hanging man without a bearish follow-through candle is just a warning, and many resolve back into the uptrend. A confirmed signal is far more dependable than an unconfirmed one.
Timeframe shapes reliability too. A hanging man candle on a daily or weekly chart tends to hold more weight than one on a one-minute chart, where noise produces frequent false signals.
Supporting tools round it out. Traders often pair the pattern with support and resistance, volume, or momentum readings as part of their hanging man technical analysis. Agreement across signals raises the odds the reversal holds.
The takeaway is simple. The hanging man pattern flags a possibility, not a certainty, and works as one input among several rather than a standalone trigger.
While the hanging man alone is insufficient for making trading decisions, it serves as a warning signal that buyers may be losing control and that selling pressure could increase. Traders seek additional confirmation through subsequent candlestick patterns, support and resistance levels, and other technical indicators to validate the potential reversal.
In short, identify the candle by its small body, long lower shadow, and prior uptrend, then wait for a bearish confirmation candle before the trend reversal signal carries weight. By understanding the implications of the setup within the broader market context and employing proper risk management strategies, traders can support their decision and identify different setups across the markets. Once comfortable with a strategy, traders may consider opening a forex trading account with FXOpen to apply it across more than 700 markets.
The hanging man trading pattern in technical analysis typically indicates a potential bullish trend reversal. It suggests that the buyers, who have been driving the market higher, are losing control, and the selling pressure may increase. The hanging man is represented by a small body near the top of the candlestick, a long lower shadow, and little to no upper shadow.
No, there is no such thing as a bullish hanging man candlestick pattern. The bearish hanging man pattern indicates a potential trend reversal from an uptrend to a downtrend.
The reliability of the hanging man pattern, like that of any candlestick formation, depends on the broader market context and supporting technical signals. Although it is widely recognised as a potential bearish reversal pattern, it isn’t used as the sole basis for trading decisions. Traders typically seek confirmation through subsequent bearish price action, such as a strong bearish candle following the pattern, as well as additional technical indicators that support the likelihood of a trend reversal.
A confirmation candle for the hanging man is a bearish candlestick that follows the pattern, confirming the reversal. This can include a bearish engulfing candle or a candlestick closing well below the hanging man's body, indicating increased selling pressure.
Yes, it is generally considered a bearish pattern that appears after a strong uptrend. It is formed when the price’s open or close is near or at its high and there is a significant decline during the trading session.
No, colour is secondary. A hanging man can close red or green, and both versions are valid. However, a bearish red close adds weight, since it shows sellers ended the session in control. The shape and the prior uptrend drive the hanging man candle meaning far more than the body colour.
Yes. The hanging man appears across forex, stocks, indices, commodities, and other markets on any timeframe. In hanging man forex trading, it often forms on major pairs after a sustained uptrend. The signal reads the same way regardless of instrument, though confirmation and market context still decide its reliability.
Higher timeframes tend to be more reliable. A hanging man on a daily or weekly chart usually carries more weight than one on a one-minute chart. Lower timeframes produce more noise and more false signals. Many traders treat the hanging man trading pattern as stronger when it forms on longer timeframes near key levels.
Traders often pair the candle with momentum and trend tools. Common choices include the RSI, moving averages, volume, and resistance levels. These may help confirm whether the bearish reversal candlestick signal is likely to hold. No single indicator confirms the pattern alone, so agreement across several tools tends to raise the odds.

