The Fixed Range Volume Profile (FRVP) is a technical analysis tool that allows traders to spot where trading volume has concentrated within a chosen price range. It shows the trading volume traded at each price level. Traders read these levels to gauge market participation and to locate potential support and resistance levels. Higher-volume prices tend to mark stronger areas of interest.
The Fixed Range Volume Profile (FRVP) is a popular tool among traders as it provides a wide range of signals. However, its complex appearance can put some traders off. In this article, we’ll take a deep dive into the FRVP, how to use it in a trading strategy, and some common mistakes to avoid.
The Fixed Range Volume Profile (FRVP) is an advanced tool that plays an important role in assessing market activity. It provides a comprehensive view of the market by shedding light on trading volume and price data over a specific period. Unlike traditional price-based indicators, the FRVP incorporates volume data, offering a deeper insight into market liquidity and supply and demand dynamics.
Most chart indicators measure market activity against time. The FRVP measures it against price instead. It groups the volume traded at each price level inside a fixed range. This shows where buyers and sellers were most active. Compared with other volume indicators that plot volume bar by bar, the FRVP reveals which prices mattered, not which moments. This makes imbalances between supply and demand more straightforward. A price with heavy volume saw strong participation. A price with light volume saw little.
The FRVP presents a distribution of trading activity, represented by horizontal bars at various price levels, typically from one key swing point to another (e.g. a swing high to a swing low). It shows areas of high and low activity and may help traders spot areas where the market has spent considerable time and where it traded through easily.
Traders anchor the FRVP between two swing points because that range captures one complete move. The profile then reflects only the volume traded during that leg. This keeps the analysis focused, rather than spread across the whole chart. Many traders bracket a trend leg, a range, or a sharp news-driven move. The result is a clearer read of where value built up inside that move.
So how does the Fixed Range Volume Profile work? The FVRP indicator measures volume at price across a range you define. You pick a start point and an end point on the chart. The indicator then adds up the volume traded at each price level and stacks the totals sideways. The longer the horizontal bar, the more volume changed hands at that price.
In trading, volume measures the total units traded over a given period. It signals how much interest sits behind a price move. High volume points to strong participation and an active market. Low volume points to weaker interest and a more passive one. The Fixed Range Volume Profile indicator takes that idea and ties it to price, not the clock.
This is where volume profile trading differs from standard volume bars. A tall bar shows a price where the market was active. This reflects acceptance, a core idea in auction market theory and price discovery. A short bar shows a price the market passed through fast. Acceptance builds value. Rejection moves price on. Reading the two together shows where business was actually done.
The calculation runs in four steps:
The result locks to the move you chose. Scrolling or zooming the chart does not change it.
The Fixed Range Volume Profile can be broken down into several key components. Each one marks a different type of price behaviour inside your selected range. Read together, they show where the market built value and where it moved on. These definitions follow standard volume profile methodology used across charting platforms.
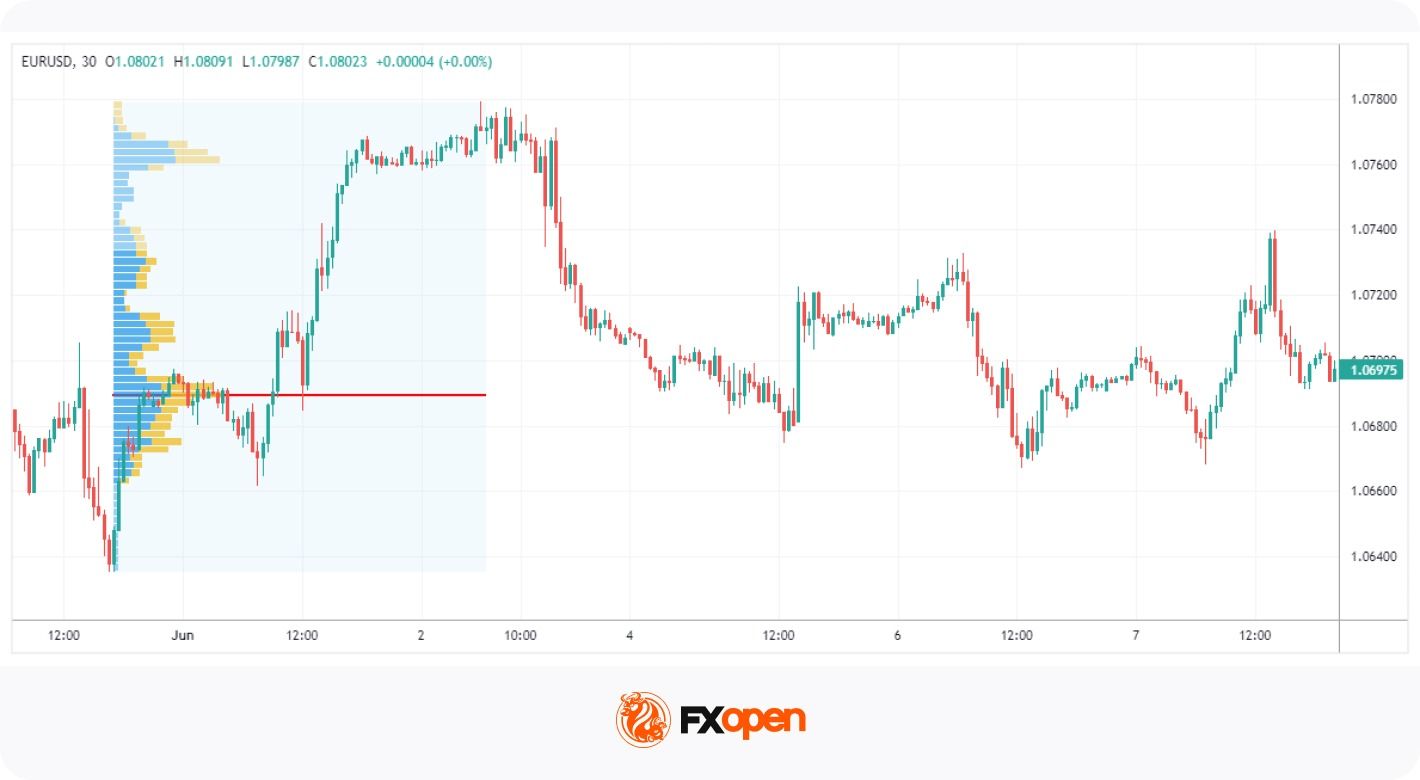
The Point of Control (POC) is the price level with the highest traded volume within the selected range. The POC can be considered as the price level where the market found the most acceptance and is usually plotted as a red line. It is often the most watched level in the whole profile. Traders treat the POC as a balance point. Price tends to return to it over time. That makes the POC a level where support or resistance can form.
The Value Area represents the price range where a specified percentage of total volume has occurred, typically 70%. It demonstrates the levels at which most trading activity has transpired. The upper boundary is the Value Area High (VAH). The lower boundary is the Value Area Low (VAL). Traders treat the VAH and VAL as the boundaries of fair value. Price inside the Value Area points to balance. A move beyond either edge can signal the market is seeking new value. Both edges often draw reactions when price tests them.
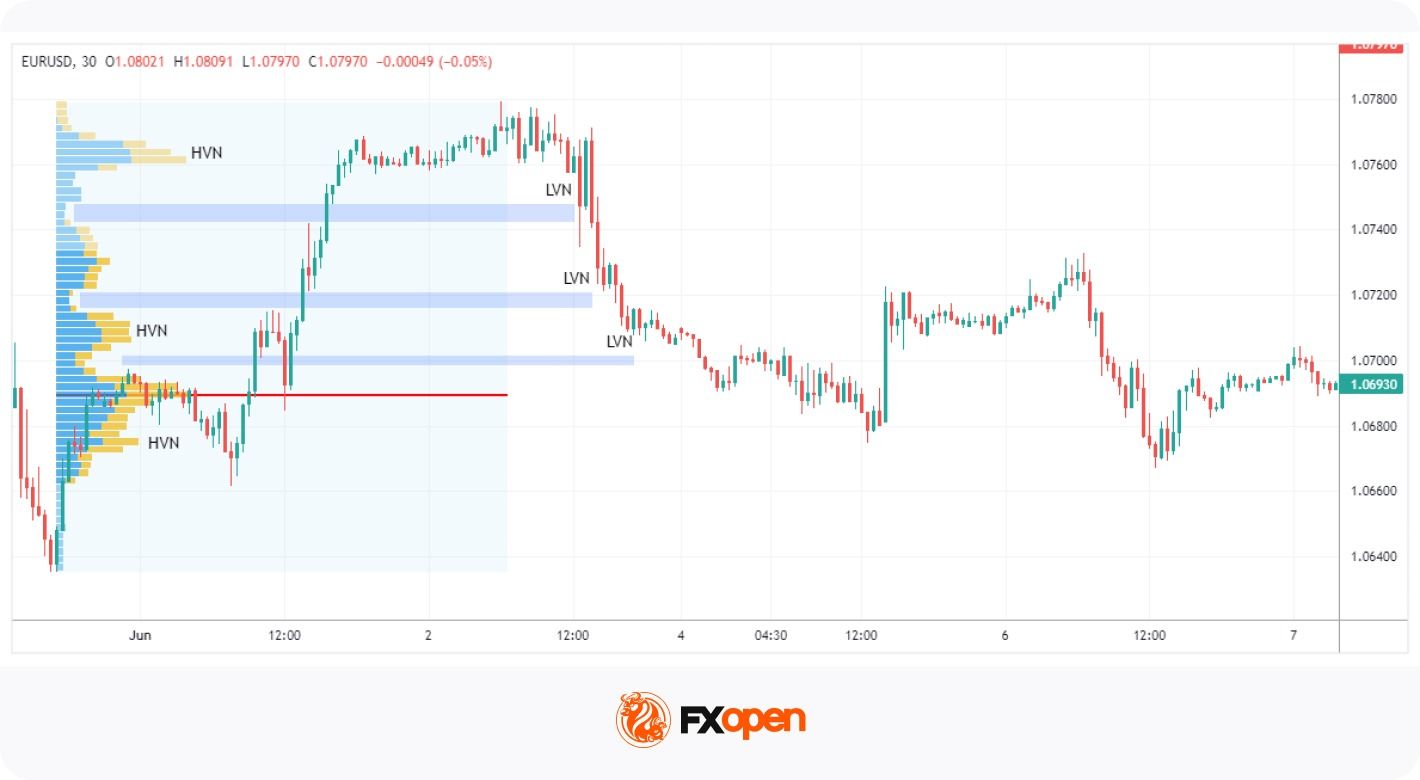
A High Volume Node (HVN) represents a peak in volume at a price level. It marks a price the market accepted and traded heavily. HVNs often act as strong support and resistance, as price tends to slow around them. Several HVNs can sit close together to form a wider zone of interest.
A Low Volume Node (LVN) represents a trough in volume at a price level. It marks a price the market rejected and moved through quickly. Price tends to travel fast across LVNs toward the next HVN. These thin zones often highlight potential breakpoints in a move.
Both nodes play key roles in volume profile analysis. With the POC, they give traders reference points for reading market structure.
Now that we’ve answered, ‘What is the Fixed Range Volume Profile?’, let’s take a look at three ways to incorporate the indicator into a strategy. The tool is rarely used on its own. A sound Fixed Range Volume Profile strategy combines it with price action and risk management. The profile shows where volume sits. Price action confirms how the market reacts there.
If you’d like to see how it works for yourself, you can consider heading over to FXOpen’s TickTrader platform and test the Fixed Range Volume Profile.

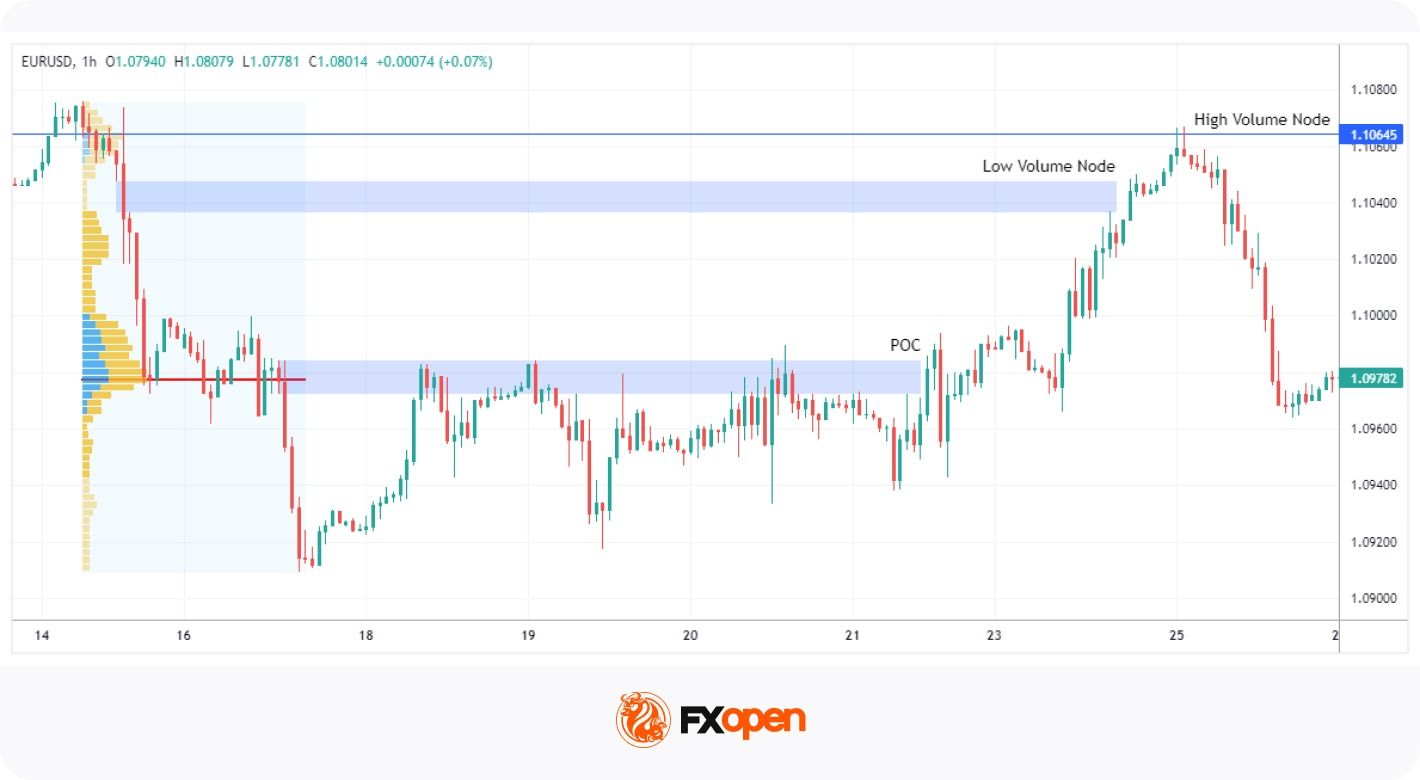
One of the most common applications of the Fixed Range Volume Profile is its use in gauging market trends. The interaction of price with high and low-volume areas can give valuable insights into market sentiment.
When analysing market trends using the FRVP, traders first pay close attention to areas of low volume, or LVNs. These areas, characterised by limited trading activity, often suggest an imbalance between supply and demand where the market moved rapidly. As such, they create a price gap or vacuum in the profile.
In the markets, these low-volume gaps are likely to be filled over time. An asset’s price usually tends to move quickly through these areas in search of the next area of value, represented by HVNs. As such, LVNs can act as powerful directional indicators, pointing to the potential for swift price movements, either upward or downward, to reach the next HVN, where market acceptance is greater.
This is the core of HVN and LVN trading: price tends to travel from one value area to the next. It moves fast through thin LVN zones and slows at dense HVN ones. In a bullish case, price clears an LVN and runs up toward a higher HVN. In a bearish case, it drops through an LVN toward a lower HVN. Traders watching for trend continuation often note a few things:
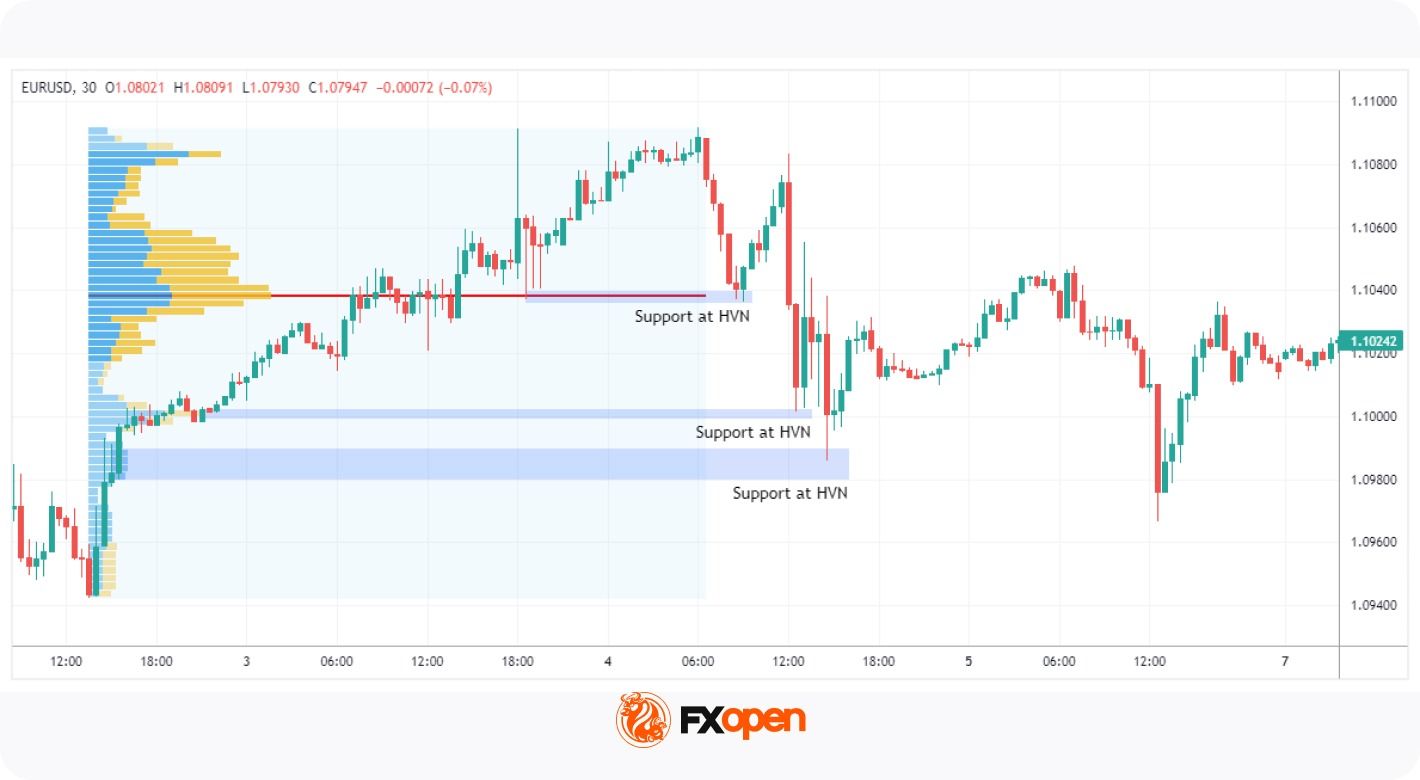
The FRVP can be an invaluable tool in identifying support and resistance levels. HVNs often indicate levels of strong support or resistance as they reflect periods where a significant amount of trading has occurred. These are areas where the market has shown acceptance, often making them difficult to breach.
Conversely, LVNs, with their relatively lower trading activity, often highlight potential breakpoints. Because these are levels at which the market has shown rejection. They are less likely to act as strong support or resistance areas, and the price is more likely to pass through them more quickly.
The split comes down to acceptance versus rejection. Where the market accepted price, volume built up and a zone holds. Where it rejected price, volume stayed thin and the zone gives way. Using the Fixed Range Volume Profile for support and resistance rests on reading that difference. The table below summarises how the two nodes tend to behave.
Feature | High Volume Node (HVN) | Low Volume Node (LVN) |
Volume traded | High | Low |
Market behaviour | Acceptance | Rejection |
Effect on price | Slows or stalls | Moves through quickly |
Typical role | Support or resistance zone | Potential breakpoint |
Price tendency | Tends to react | Tends to travel |
Therefore, traders can use HVNs and LVNs as a basis to establish potential entry and exit points in their trading strategies. For example, a trader may consider entering a long position when the price breaks above an HVN (an area of resistance). Similarly, an LVN above the current price might be a good target for this long trade, as the price could rise quickly to this level.
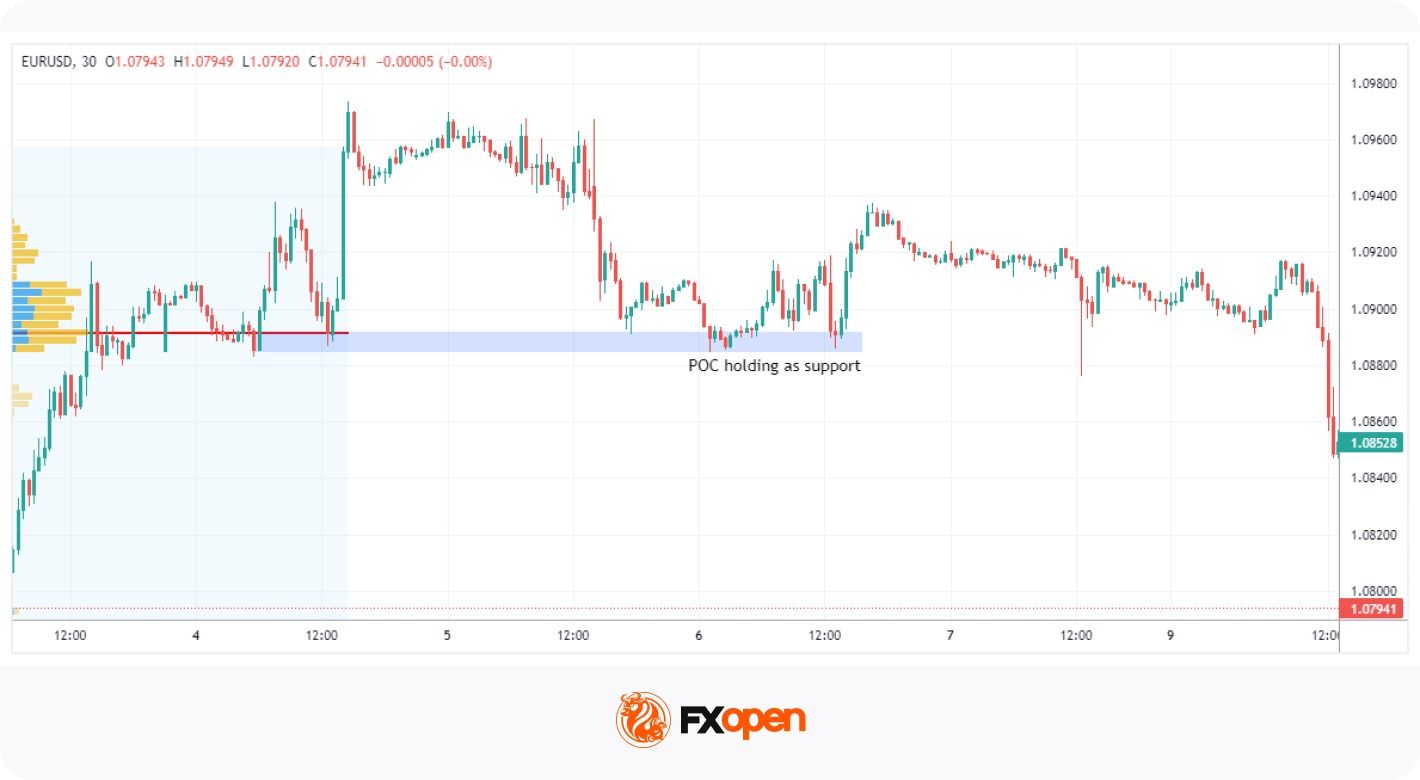
In addition to HVNs and LVNs, the Point of Control (POC) is another widely used element within the Fixed Range Volume Profile. Price often revisits the POC because it marks the range's balance point. It is where the most business was done, so the market treats it as fair value.
In an upward-trending market, the POC often acts as a support level, where buyers may enter or add to long positions, expecting the price to bounce back upwards. Conversely, in a downward-trending market, the POC can serve as a resistance level, where sellers might consider short positions, anticipating market rejection.
In a broader Fixed Range Volume Profile strategy, traders often look at:
The Fixed Range Volume Profile is one of three common volume profile types. The other two are the Session Volume Profile and the Visible Range Volume Profile (VRVP). All three plot volumes by price. They differ in how the range is set.
The Fixed Range Volume Profile vs Session Profile vs Visible Range Volume Profile question comes down to control. With FRVP, you pick the start and end points by hand. The profile then stays locked to that move. The Session Volume Profile sets its own range. It resets automatically at the open of each trading session. The Visible Range Volume Profile uses whatever bars are on screen. It redraws as you scroll or zoom.
Profile type | How the range is set | Commonly used |
Fixed Range Volume Profile | Manually selected start and end points | Studying a single move, leg or consolidation |
Session Volume Profile | Resets automatically each session | Studying a single move, leg or consolidation |
Visible Range Volume Profile | Whatever is visible on screen | Quick, broad views across the current chart |
Traders pick the tool to match the question. FRVP is used for a completed move traders want to study closely. The Session Volume Profile is popular for intraday work, where each day's value matters. The Visible Range Volume Profile is applied for a fast read of the wider chart. Many traders run more than one together. A fixed range over a key leg, paired with the current session, can give context that neither offers alone.
The range you choose shapes everything the FRVP shows you. The same chart can produce different profiles depending on where you start and finish. So the choice of range is the important decision when using the tool. A well-chosen range captures one clean phase of market activity. A poorly chosen one mixes unrelated moves and blurs the read.
Most traders anchor the profile between two clear points. A swing high to a swing low is the common choice, as it brackets a single move. This ties the profile to a defined piece of market structure rather than an arbitrary stretch of chart.
Several range types tend to suit the tool:
Because the output depends on the input, two traders can read the same chart differently. One brackets the whole trend. Another brackets only the latest leg. Both profiles are valid, but they answer different questions. Many traders test a few ranges over the same area. They look for levels that hold up across more than one selection, since those tend to carry more weight.
In this example, we see the market cooling off after a prolonged uptrend to the left (finishing just on the edge of the chart). The price fell sharply, finding a bottom. Given the distinct high and low points, the FRVP tool is set to those two points. The walkthrough below breaks the move into five steps.
So what are the common mistakes many traders make when using the Fixed Range Volume Profile indicator? The list below covers the ones that catch traders out most often.
Like any tool, the FRVP indicator has clear strengths and real limits. Knowing both may help traders use it in the right place. It reads volume well, but it does not act as a standalone system.
On the plus side, the volume profile indicator shows where genuine activity occurred, not just when. It ties volume directly to price, which standard volume bars cannot do. It also locks to a chosen move, so the analysis stays focused. That makes it useful for marking support, resistance and likely target zones.
The limits matter just as much. The FRVP reflects past activity, so it offers no guarantee about future moves. Its output depends entirely on the range you select, which adds a layer of judgement. On forex charts, the volume shown is often tick volume rather than true traded volume. And the tool is always combined with other forms of analysis.
Advantages | Limitations |
Shows volume by price, not just by time | Reflects past activity, not future moves |
Locks to a chosen move for focused analysis | Output varies with the range selected |
Highlights support, resistance and target zones | Forex volume is often tick-based |
Pairs well with price action and structure | Works poorly as a standalone tool |
The Fixed Range Volume Profile may help traders analyse where trading activity was concentrated within a selected price range. By highlighting key areas such as the Point of Control, Value Area, High Volume Nodes, and Low Volume Nodes, it provides additional context on where the market found acceptance or rejection.
Like any technical tool, the FRVP is commonly used alongside price action analysis, market structure, and risk management. Since the profile's output depends heavily on the range selected, traders typically take care to choose ranges that reflect meaningful market swings or trading sessions.
With an understanding of how to use the FRVP indicator, you might consider opening a trading account with FXOpen to access over 700 markets across forex and CFDs.
Fixed Range Volume Profile (FRVP) is a volume analysis tool that displays how much trading activity occurred at different price levels within a user-defined range. Instead of focusing on volume over time, it organises volume by price, which may help traders identify areas where the market spent the most and least effort transacting.
The Point of Control (POC) is the price level that recorded the highest trading volume within the selected range. Traders often monitor the POC because it can represent a key area of market acceptance, where buyers and sellers were most active, and where price may later find support, resistance, or balance.
High Volume Nodes (HVNs) are price levels where a large amount of trading occurred, often indicating areas of market acceptance and potential support or resistance. Low Volume Nodes (LVNs) are levels with relatively little trading activity and may represent zones of rejection where price can move through more quickly.
The main difference is that FRVP analyses a manually selected price range, allowing traders to focus on specific market swings, consolidations, or trends. Session Volume Profile, by contrast, automatically calculates volume distribution for predefined trading sessions without requiring manual range selection.
Many traders use FRVP to identify potential support and resistance areas. High Volume Nodes and the Point of Control often highlight prices where significant trading activity occurred, which can attract future market interest. However, these levels are not guaranteed to hold and are typically assessed alongside other forms of technical analysis.
The Value Area is the range of prices that contains approximately 70% of the total traded volume within the selected profile. It is bounded by the Value Area High (VAH) and Value Area Low (VAL). Traders often use these levels to assess whether price is trading in an area of perceived value or moving beyond it.
FRVP can be applied to a wide range of markets, including forex and CFDs. The tool is particularly popular among traders who analyse market structure and volume distribution, as it may help highlight areas where significant trading activity has taken place.

