An overbought stock has risen sharply and may sit above its underlying value, while an oversold stock has fallen sharply and may sit below it. In technical analysis, these conditions are used to identify markets that may be approaching a pause, slowdown, or potential price reversal.
The oversold stock meaning refers to a market condition where selling pressure has pushed a stock’s price lower than its recent trading range or momentum may justify. Overbought conditions reflect the opposite scenario, where strong buying activity has driven prices rapidly higher.
To identify these market conditions, traders often use technical indicators such as the Relative Strength Index (RSI), Stochastic Oscillator, and MACD. This article explains what overbought and oversold stocks and stock CFDs are, how these indicators work, and the limitations traders should consider when interpreting their signals.
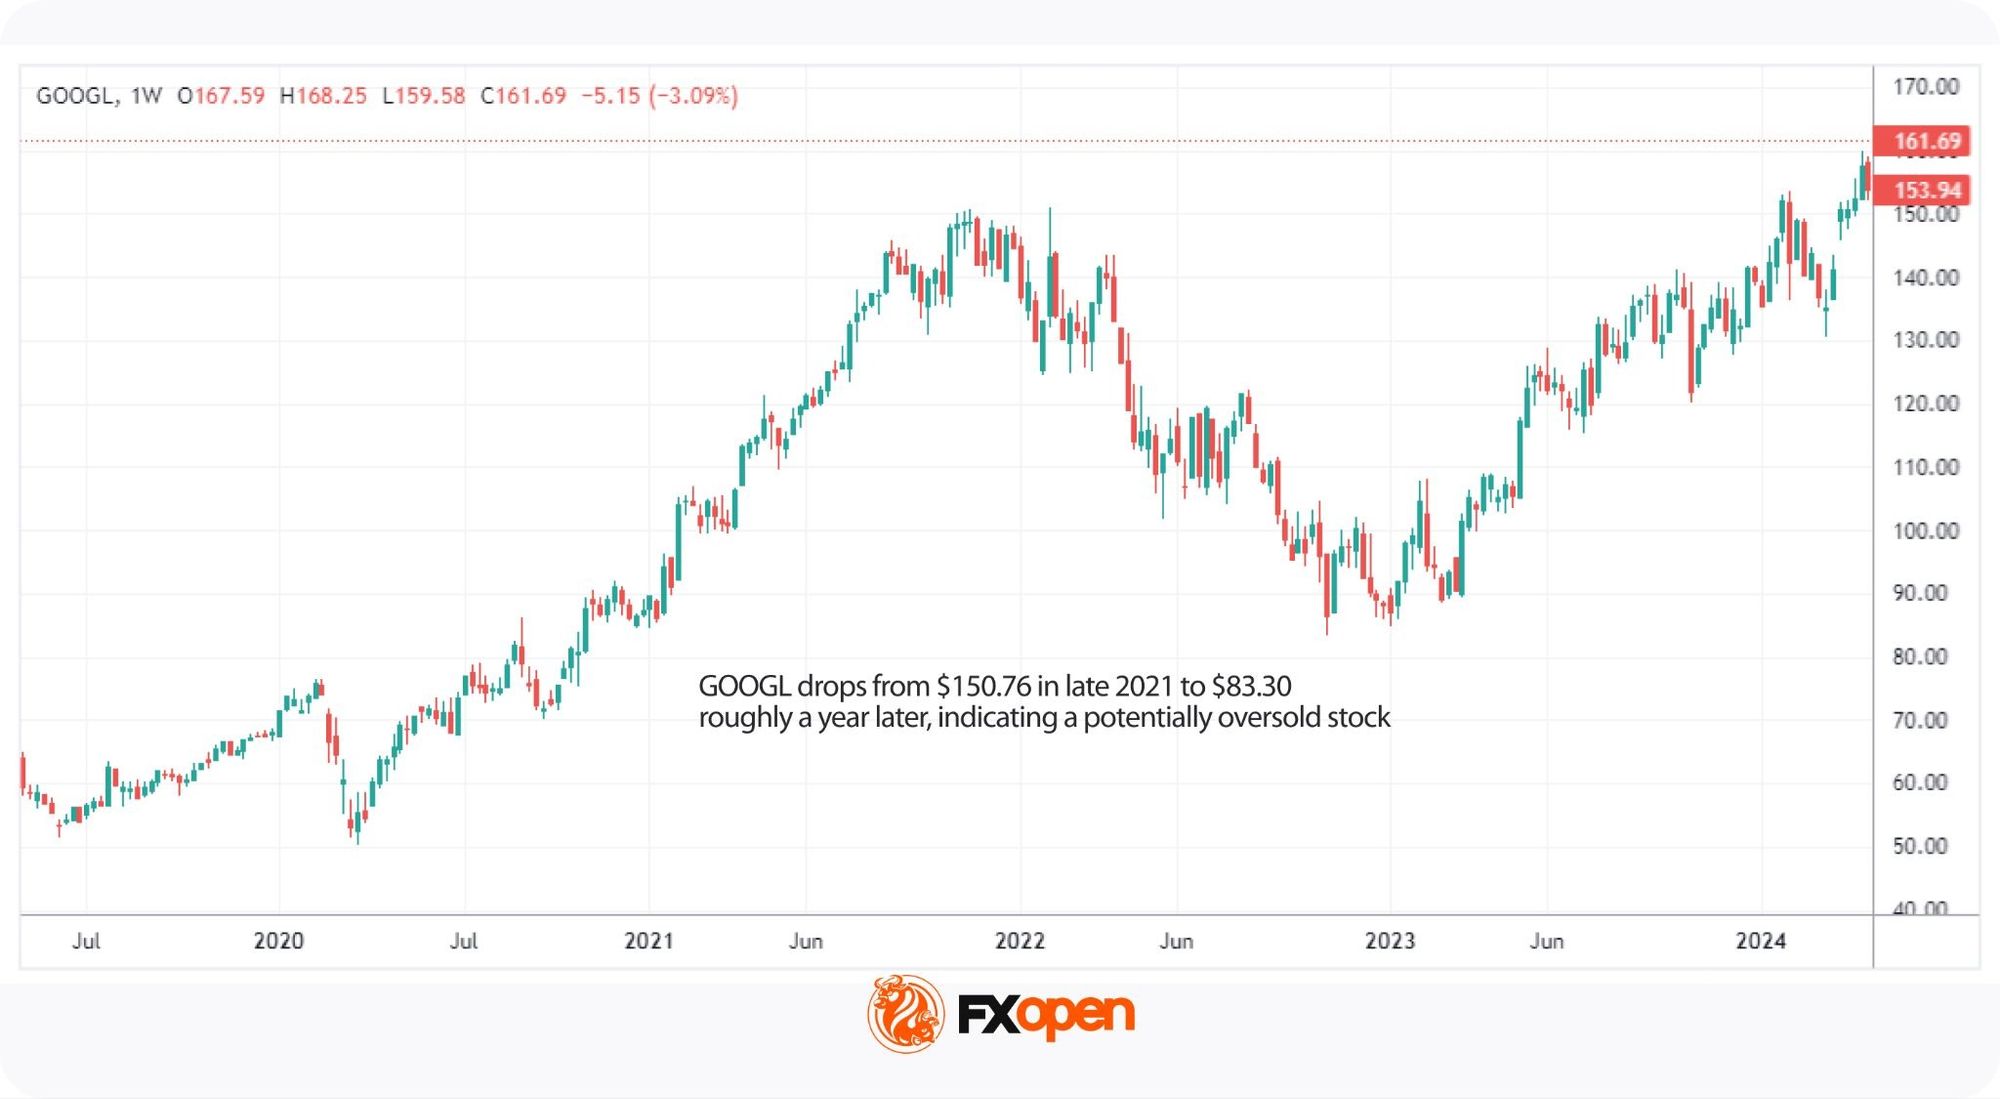
Oversold stocks are shares that have fallen sharply in price, often below what their fundamentals warrant. The condition typically reflects excessive selling pressure rather than a fair reassessment of value.
Several factors can lead to a stock becoming oversold. For instance, bad news about a company, such as a missed earnings report or legal troubles, can cause investors to sell off shares quickly. Broader market events, like economic downturns or changes in industry regulations, can also drive prices down across the board. Sometimes, even strong stocks get caught up in these waves of negativity.
A clear example is the March 2020 market sell-off, when widespread panic during the early stages of the pandemic pushed stocks down across nearly every sector. Many recovered within months as fundamentals held up.
Overselling reflects more than a falling price, though, because it also points to the potential for a reversal once selling pressure fades.
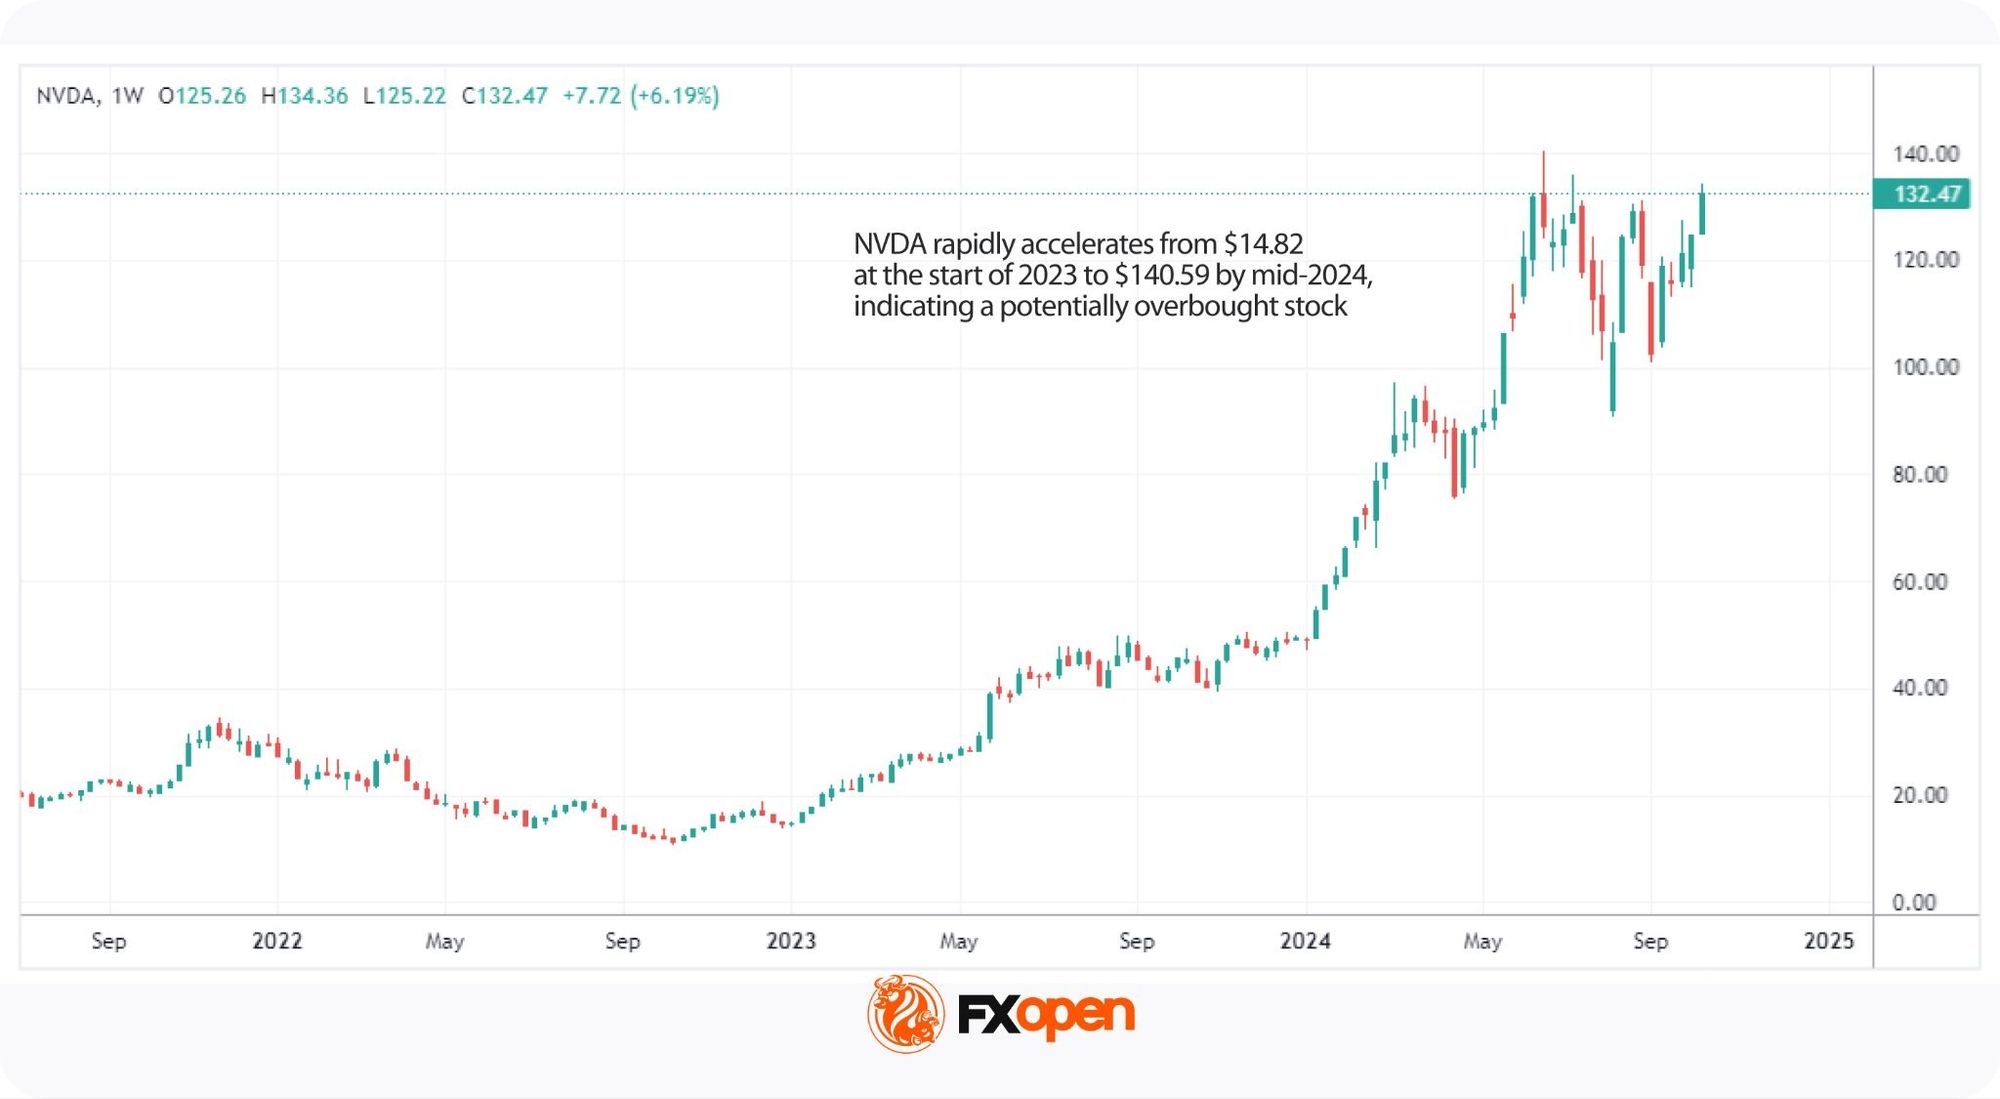
Overbought stocks are shares that have risen sharply in price, often above what their fundamentals warrant. The overbought condition typically reflects strong buying activity rather than a fair reassessment of value.
Several factors can lead to an overbought market. Sometimes, positive news about a company—such as strong earnings, new product launches, or positive analyst reports—can spark a wave of buying. Market-wide optimism, particularly during bullish phases, can also lead to an overbought stock market. Speculative buying, where traders hope to capitalise on short-term price movements, can further inflate the price.
A notable example is the AI-driven rally in mega-cap technology stocks during 2024, when names like Nvidia spent extended periods in overbought territory as enthusiasm around generative AI pushed valuations to record highs.
Being overbought does not guarantee an immediate correction, though it does signal that the price may have moved too high, too quickly.
The overbought vs oversold distinction often hinges on sentiment as much as fundamentals. The distinction matters because each condition reflects opposite market behaviour. Overbought signals downside pressure ahead while oversold points to potential upside, so traders position differently for each.
The two conditions compare as follows:
Aspect | Overbought stock | Oversold stock |
Price movement | Risen sharply, often above intrinsic value | Fallen sharply, often below intrinsic value |
Market sentiment | Optimistic, often driven by positive news or hype | Pessimistic, often driven by negative news or fear |
Indicator readings | RSI above 70, Stochastic above 80 | RSI below 30, Stochastic below 20 |
Typical trader response | Watch for pullbacks or short setups | Watch for rebounds or long setups |
Recognising the difference between overbought stocks and oversold stocks may help traders align analysis with prevailing conditions, though neither signal guarantees a reversal and confirmation from other tools still matters.
Traders use overbought and oversold indicators to assess whether a stock has moved too far in one direction. Most of these tools are momentum oscillators that measure the speed and magnitude of price changes.
The three most common are:
Each oscillator works in a different way, but they share a common purpose: flagging when price action looks stretched relative to recent history. When a stock has moved too far from its typical range, the reading may signal a possible reversal, helping traders identify potential entry or exit points.
Now, let’s break down some of the most popular momentum indicators in trading used for this purpose. To see how they work for yourself, consider following along in FXOpen’s TickTrader trading platform to access a world of stock CFDs.
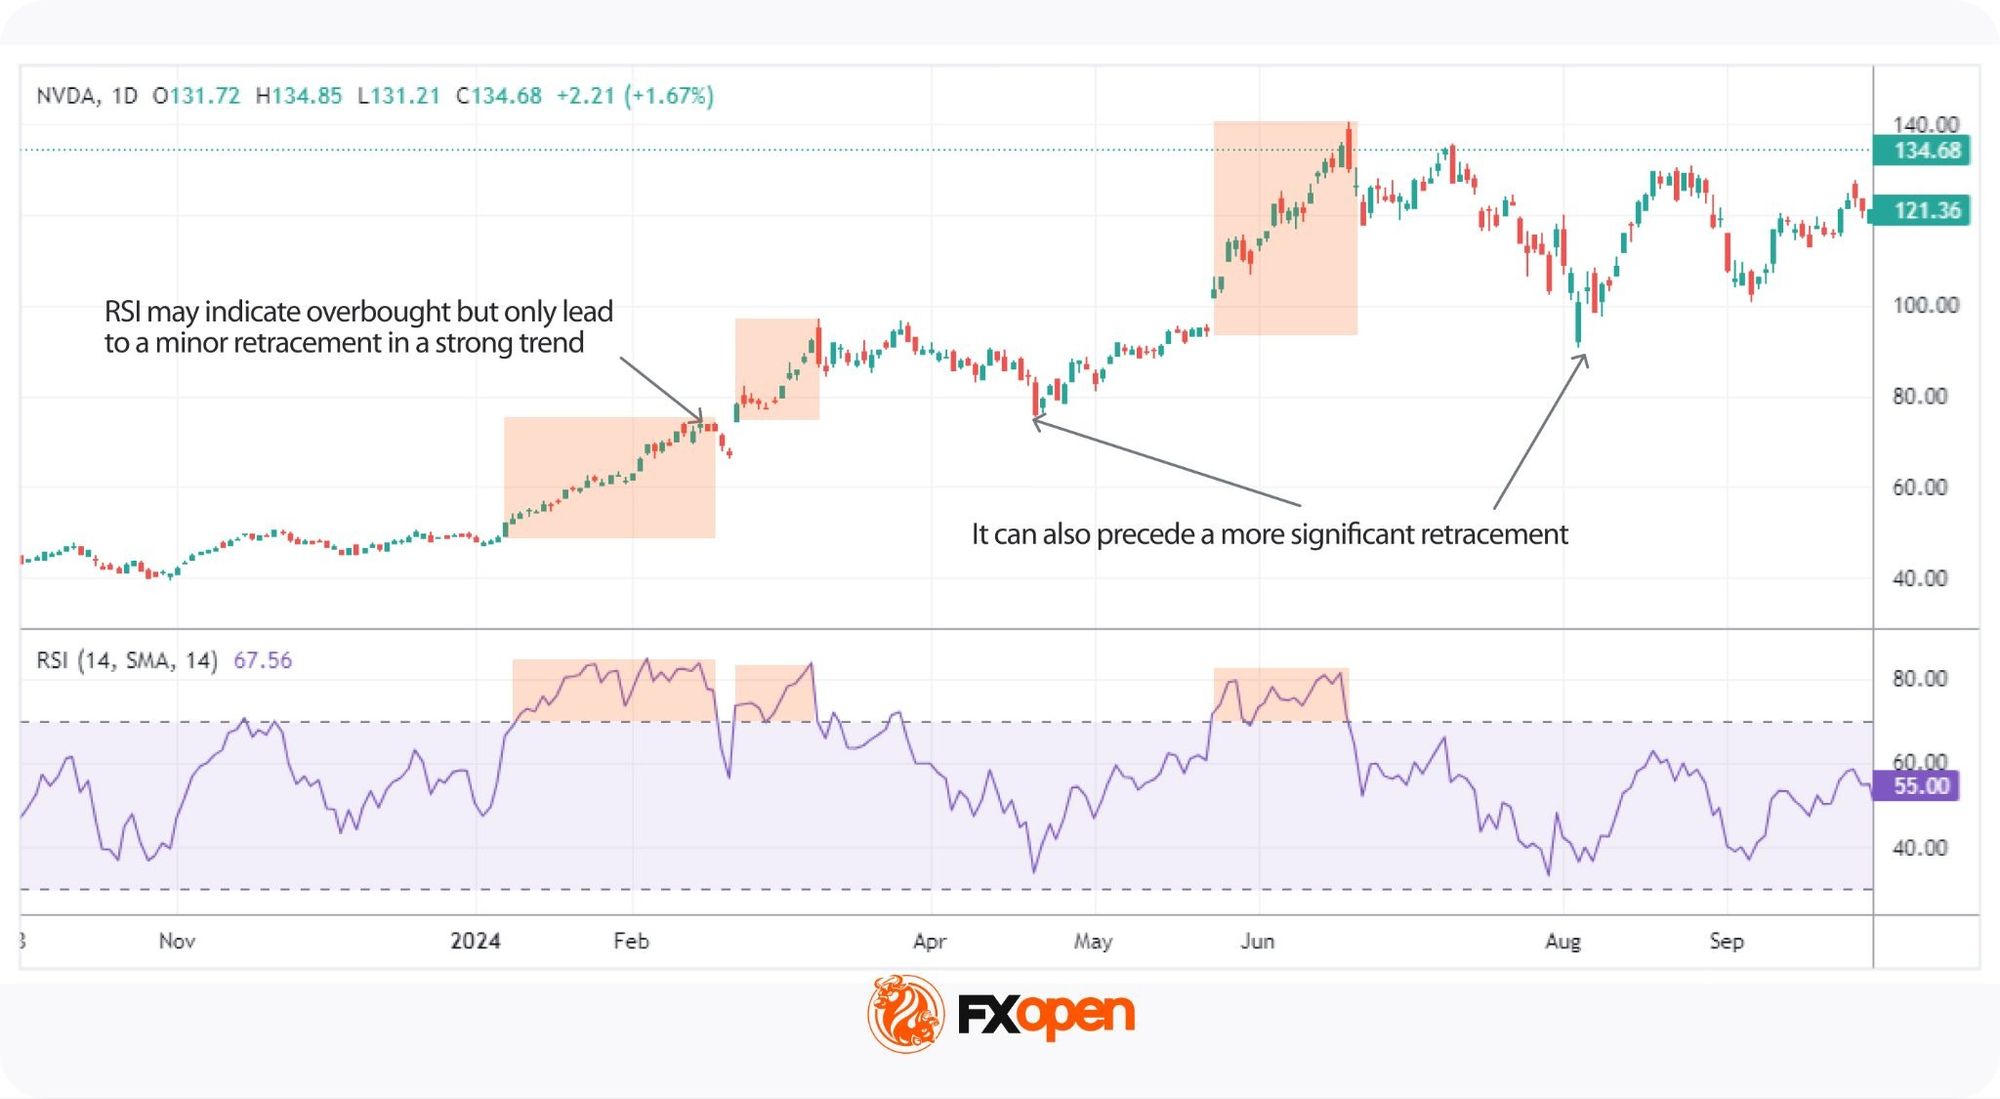
The Relative Strength Index (RSI) is a momentum oscillator that measures the speed and magnitude of recent price changes by comparing the average size of recent gains to recent losses over a set period. The standard look-back is 14 periods, with readings on a scale of 0 to 100.
The RSI oversold level is seen as below 30 and indicates the stock may be undervalued and due for a bounce. Meanwhile, the RSI overbought level sits at 70 and above, which often precedes a pullback.
For example, when a stock falls 12% over two weeks and its RSI drops to 25, traders watching for reversals would mark this as a potential setup. The same logic applies in reverse when RSI spikes above 70 after a strong rally.
Context still matters, though. In a strong bull market, a stock may stay overbought for weeks, and during a downturn, stocks can remain oversold longer than many traders expect.
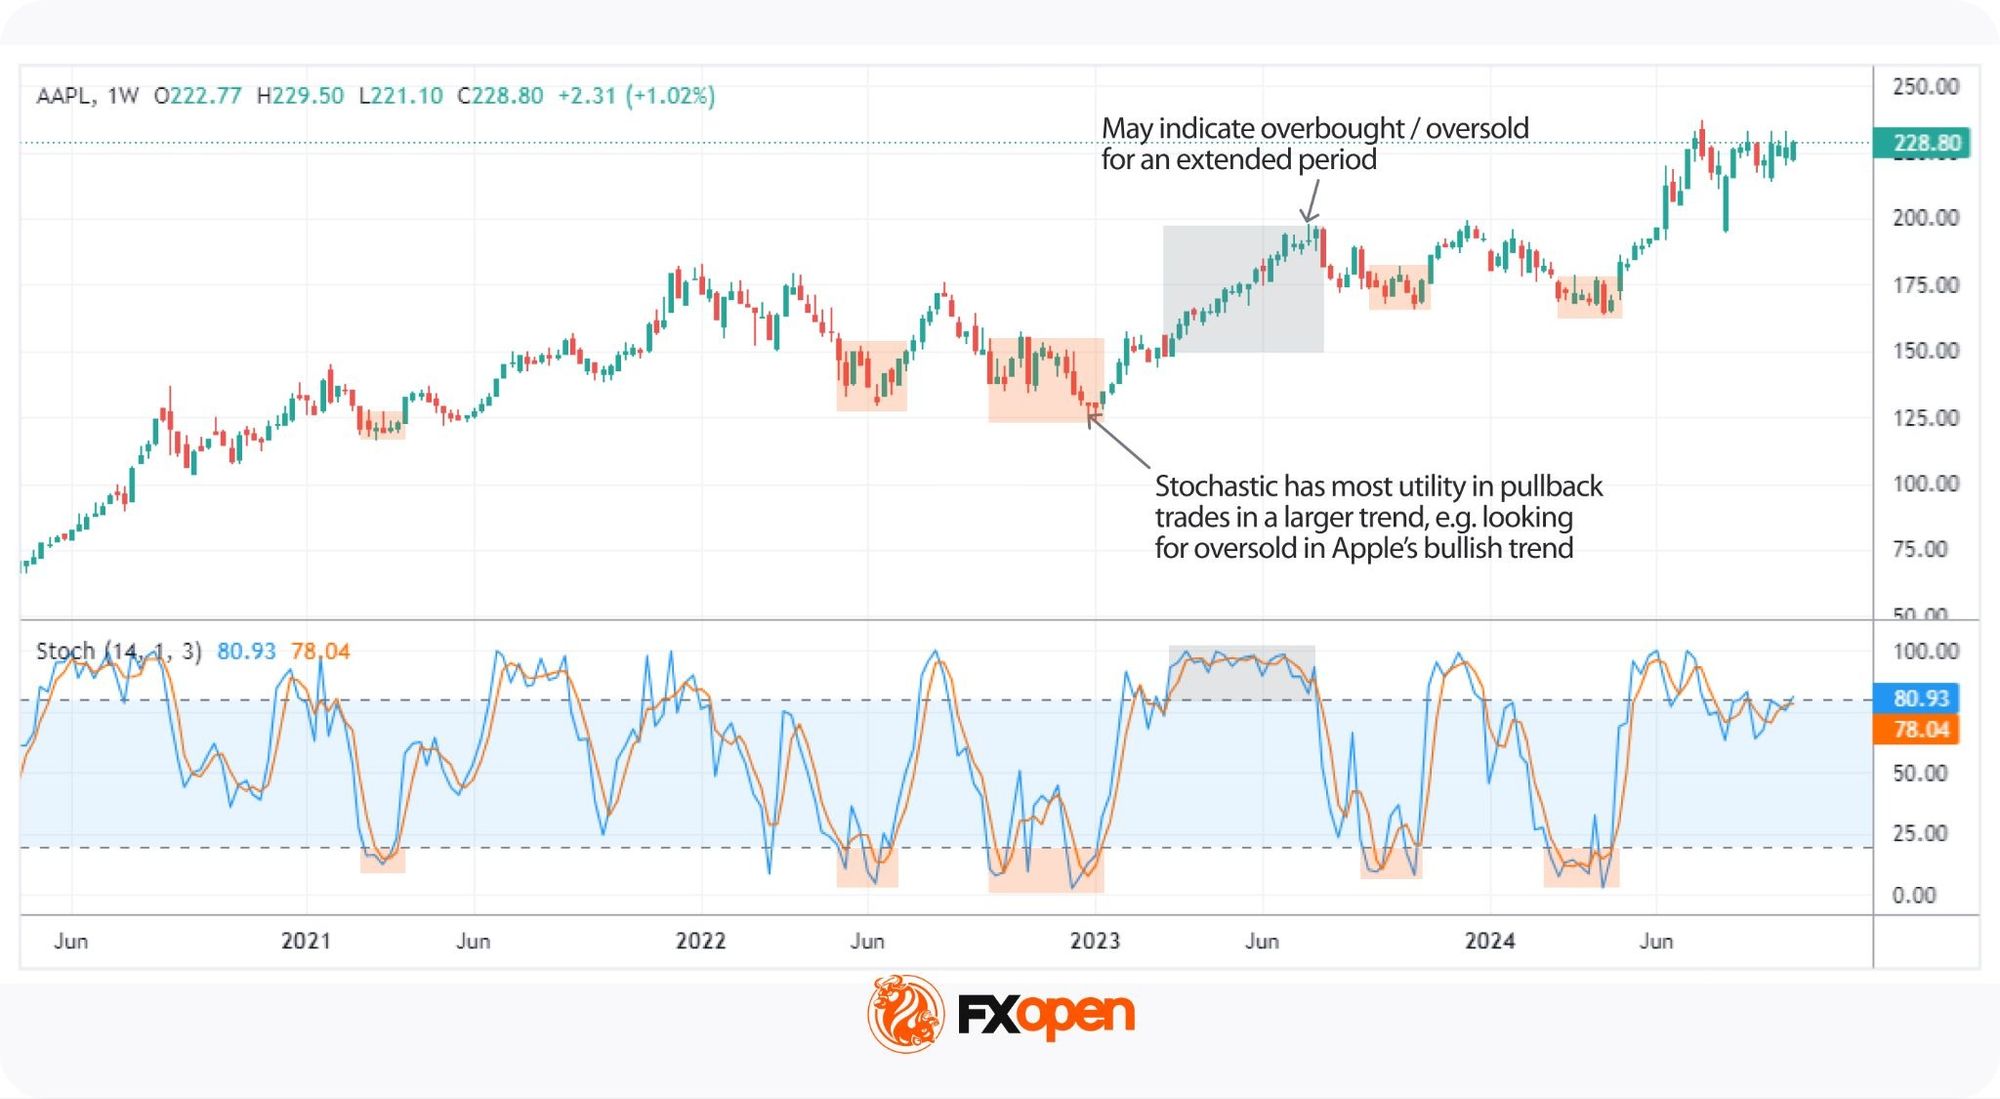
The Stochastic Oscillator is a momentum indicator that compares a stock's closing price to its price range over a defined period.
The main difference from RSI is sensitivity, because the Stochastic focuses on closing price relative to recent range, which makes it react faster to shorter-term reversals.
The Stochastic plots two lines: %K reflects the current closing position within the recent range, and %D smooths %K with a short moving average. A reading above 80 marks an overbought zone, while a reading below 20 marks a Stochastic Oscillator oversold zone.
For instance, when a stock closes near its weekly high every day for two weeks, %K typically pushes above 80, and given its sensitivity, the Stochastic can stay extended for long periods during strong trends. This makes it more prone to false signals than the RSI or MACD indicator and typically more useful for trading pullbacks in a broader trend.
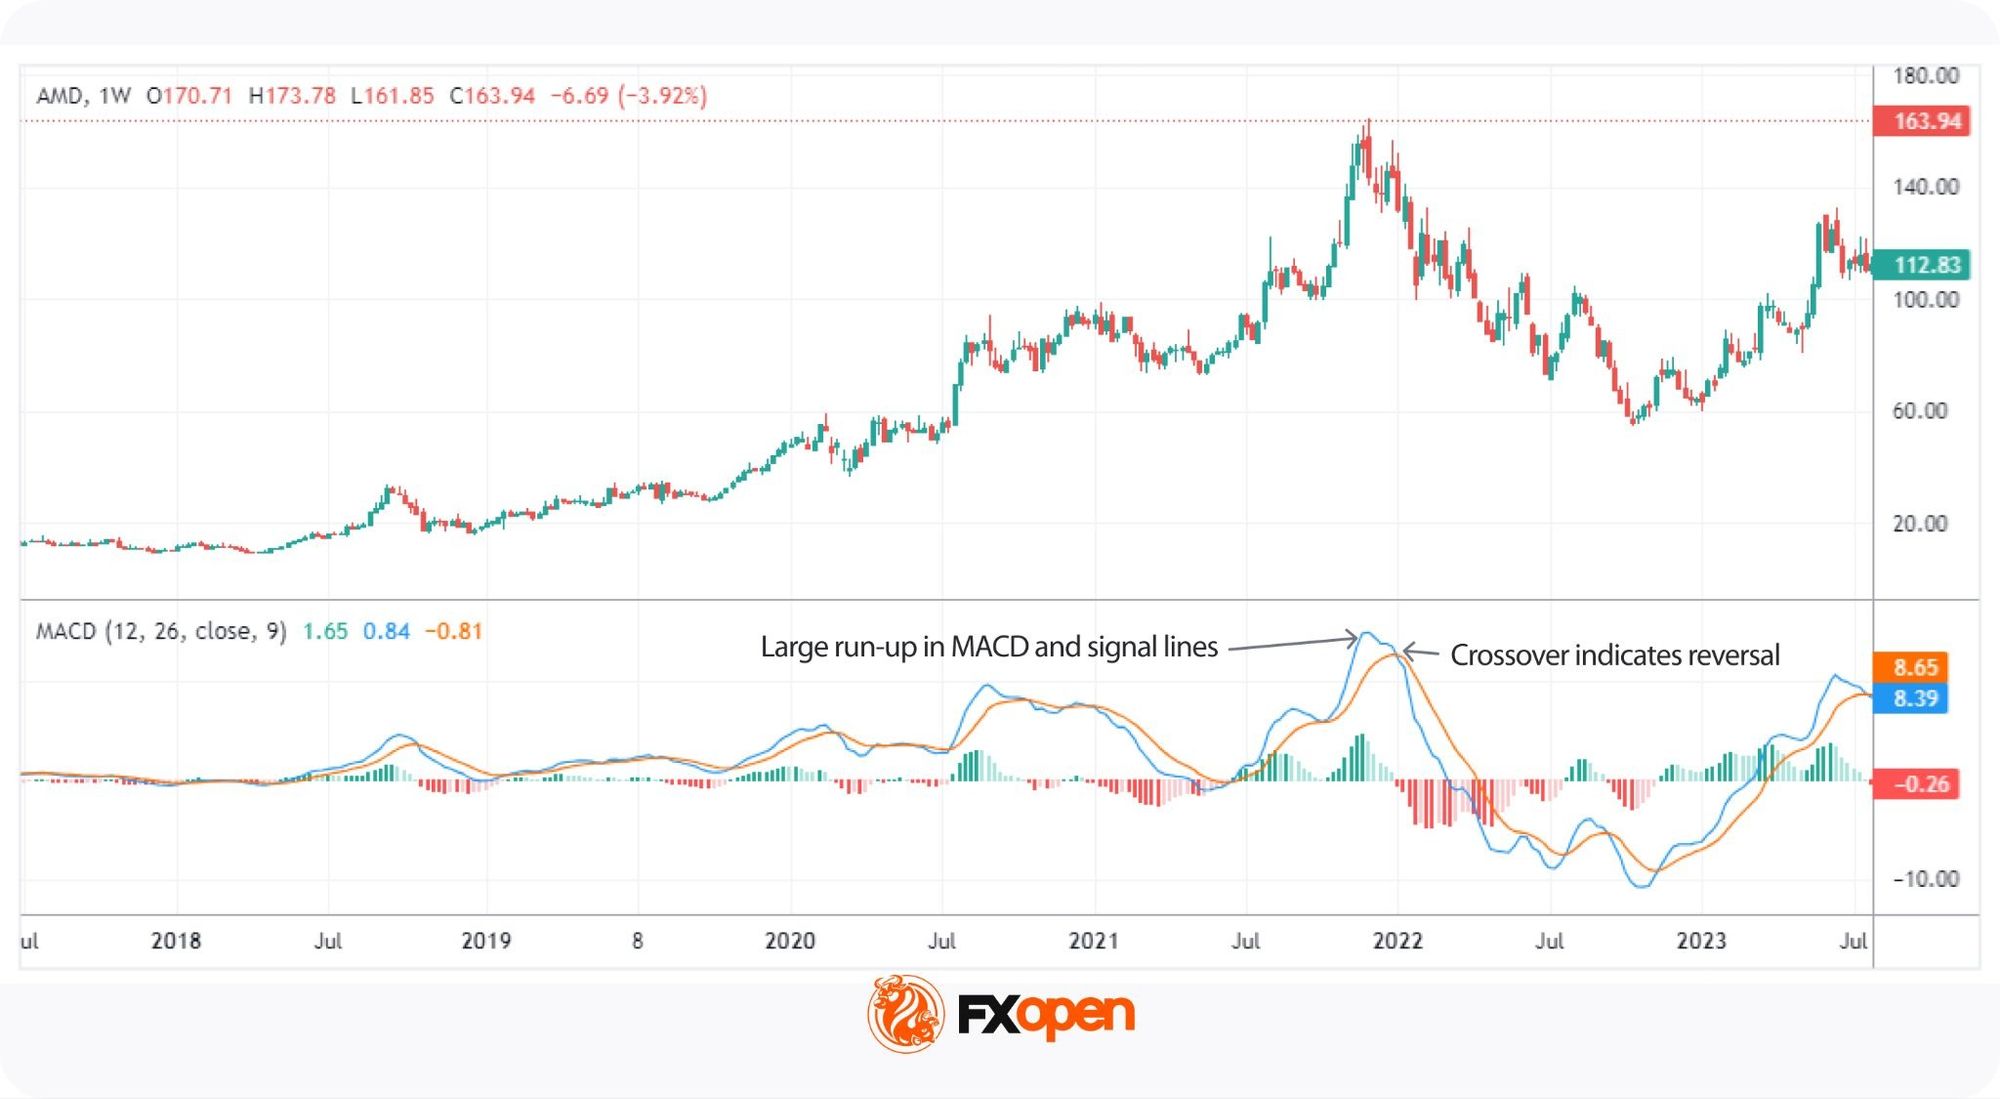
The Moving Average Convergence Divergence (MACD) is a trend-following momentum indicator that compares two moving averages of a stock's price. Unlike RSI or Stochastic, MACD is not a pure overbought or oversold indicator, since it highlights momentum shift and trend direction instead.
The MACD line tracks the gap between two exponential moving averages, typically the 12-period and 26-period, while a 9-period moving average of the MACD line forms the signal line. When the MACD line crosses above the signal line, it points to a potential bullish reversal, and a cross below points to a bearish reversal.
Traders can still gauge stretched conditions through MACD momentum signals, because when both lines sit far from the 0 midpoint and historical averages, the move may be overextended.
Momentum indicators help traders spot overextended conditions, but they carry limitations. A reading at an extreme tells you the move has been strong, though it does not tell you the move is finished. Traders who treat overbought and oversold levels as automatic triggers tend to fail.
The main limitations include:
False signals in stocks are the most common pitfall. Two practical filters reduce this risk: divergence analysis and multi-timeframe confirmation.
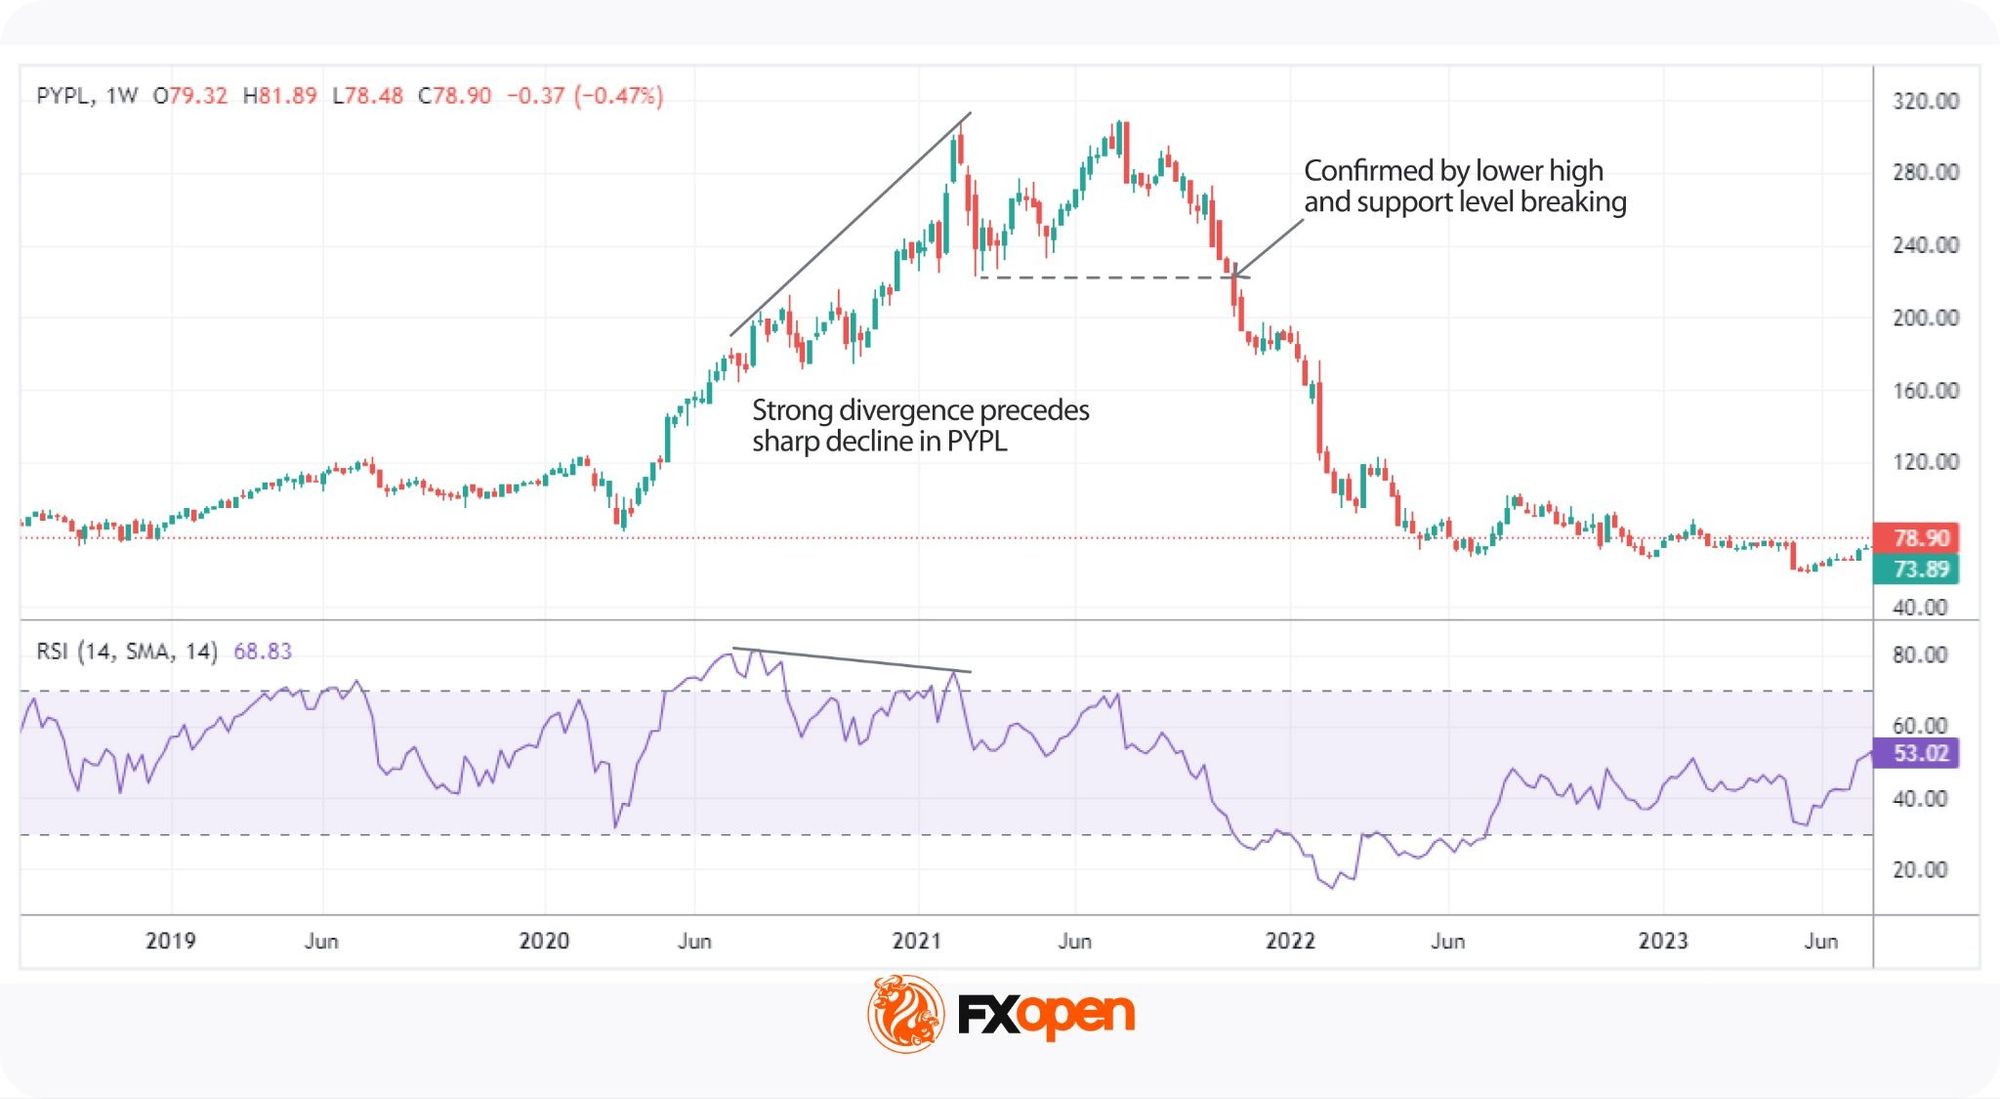
Divergence describes a price move that runs against its indicator, such as a stock pushing to a new high while RSI prints a lower high, which signals weakening momentum and a possible turn. Traders typically use divergence as a confirmation tool rather than a standalone trigger, because pairing it with a price action signal reduces the risk of acting on a false reading.
Timeframe selection shapes how overbought and oversold signals appear on a chart, because daily and weekly views can disagree on the same stock, with the daily flashing oversold while the weekly remains neutral. Traders match the timeframe to their strategy, whether short-term or long-term.
Many traders apply a top-down approach, confirming the higher timeframe direction first before refining entries on lower timeframes. This multi-timeframe check may support market analysis when readings conflict.
Trading overbought and oversold stocks carries risks beyond standard market exposure, because the signals can flag setups that never play out, and the indicators can stay at extremes for far longer than traders expect. Robust risk management practice may potentially reduce exposure to each pitfall below.
Understanding overbought and oversold stocks, along with the indicators used to identify them, can help traders spot trend changes. While these conditions may signal a reversal, it’s important to recognise there is no one best overbought and oversold indicator and use multiple tools for confirmation.
To put this knowledge into practice, you can consider opening an FXOpen account, which offers access to stock CFDs and advanced trading platforms.
Overbought and oversold are terms used to describe extreme price movements in markets. A stock is considered overbought when its price has risen rapidly and above its underlying value, which potentially makes it overvalued. It’s oversold when the price has fallen sharply and below its underlying value, which makes it undervalued. These conditions can signal that a price reversal may be coming, though they don’t guarantee it.
The overbought stock meaning refers to a stock that has increased quickly and is potentially trading higher than its actual value. This often occurs due to strong demand or market optimism. Overbought conditions might signal that the price is at risk of a pullback.
The oversold stock meaning refers to a stock that has dropped significantly and may be below its true value. This often happens when there’s been excessive selling, and it could suggest that its price is due for a rebound.
Traders often use technical indicators like the Relative Strength Index (RSI) to find the most oversold stocks. An RSI reading below 30 typically suggests that a stock is oversold and may present a buying opportunity. Other indicators, like the Stochastic Oscillator, are also commonly used to identify oversold conditions.
The difference between overbought and oversold lies in direction. An overbought stock has risen too far and may face downward pressure, while an oversold stock has fallen too far and may rebound. Both flag possible reversals.
Common indicators include the Relative Strength Index, Stochastic Oscillator, and MACD, with an RSI reading below 30 or a Stochastic below 20 typically pointing to oversold conditions. Traders often combine indicators for confirmation.
Yes, a stock can stay overbought or oversold for weeks during strong trends. In such a case, indicator readings may sit at extreme levels for long. Traders use confirmation tools to avoid premature entries.

