An imbalance in trading is a price zone where supply or demand heavily outweighs the opposite side, causing a sharp directional move with little trading in between. These zones sit at the heart of Smart Money Concept analysis. They shape how traders read momentum, structure, and entry points across forex and CFDs.
This article covers what drives imbalance in forex and CFDs and how it shows up on a chart. It walks through how an imbalance trading strategy may be built around price action, the link between an order flow imbalance and liquidity, and the difference between imbalance zones, fair value gaps, and order blocks.
Imbalance in trading is a price zone where buy or sell orders heavily outweigh the opposite side, causing a sharp directional move with little trading in between. This imbalance of orders can significantly influence asset prices, pushing them up or down. It’s a fundamental concept in forex, crypto*, commodity, and stock markets.
Three related terms appear often:
A market imbalance occurs when there's an overwhelming interest from buyers (buy-side imbalance) or sellers (sell-side imbalance) without enough opposite-side orders to match. These zones are read by retail traders as visible footprints of large activity. Institutional desks often cause the imbalance themselves through size-driven execution the order book cannot absorb on one side.
Imbalance zones in trading are critical components of the Smart Money Concept (SMC), a framework that focuses on understanding the actions of institutional investors. SMC proponents argue that by analysing where and how these imbalances occur, traders can align their strategies with those of the market's most influential players. The rationale is that institutional movements, often the cause behind significant imbalances, have the power to drive market trends.
Order imbalances in trading come in different forms depending on direction, structure, and timeframe. Knowing which type is in front of you may shape how the zone is read and what reaction is expected.
Higher-timeframe imbalances usually carry more weight than lower-timeframe ones. For deeper context on the wider zones, the FXOpen article on liquidity zones and liquidity voids covers the mechanics in more detail.
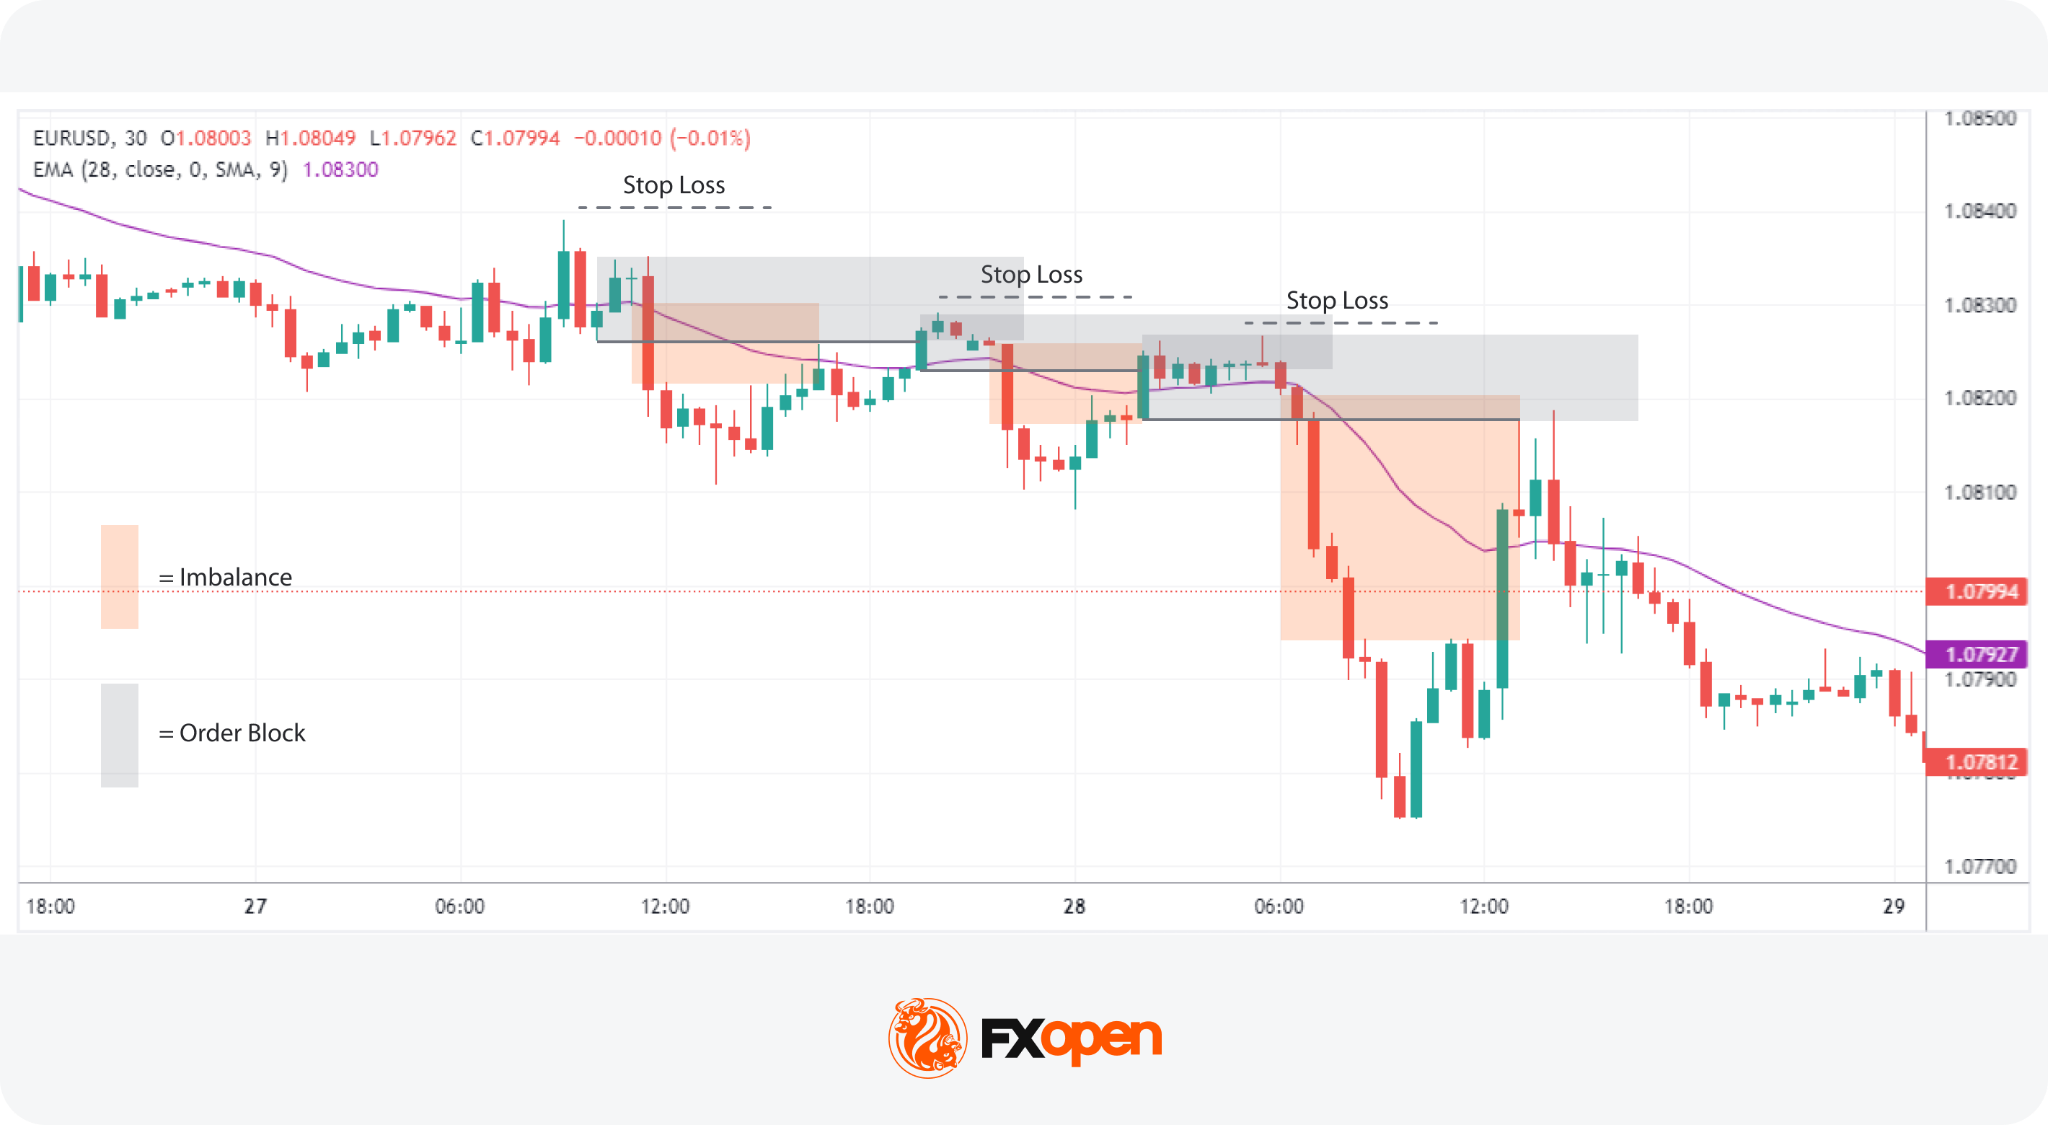
Imbalances, fair value gaps (FVGs), and order blocks are related but not identical. They sit on a spectrum of the same idea: a market inefficiency that price may return to.
Concept | What it is | How traders use it |
Imbalance | Any zone where one side of the order flow dominates and price displaces sharply | Read as a magnet for retracement and a clue to direction |
Fair value gap (FVG) | A specific three-candle imbalance where outer wicks fail to overlap | Used for tighter entries and short-term confluence |
Order block | The last opposing candle before a strong move that breaks structure | Used as a reaction zone aligned with the higher-timeframe trend |
An imbalance is the broad category. A fair value gap in forex is one specific imbalance pattern. An order block is the cause behind many imbalances, not the imbalance itself. Traders often combine the three: a fair value gap that forms just after an order block, in line with the prevailing trend, may carry stronger confluence than any single element alone.
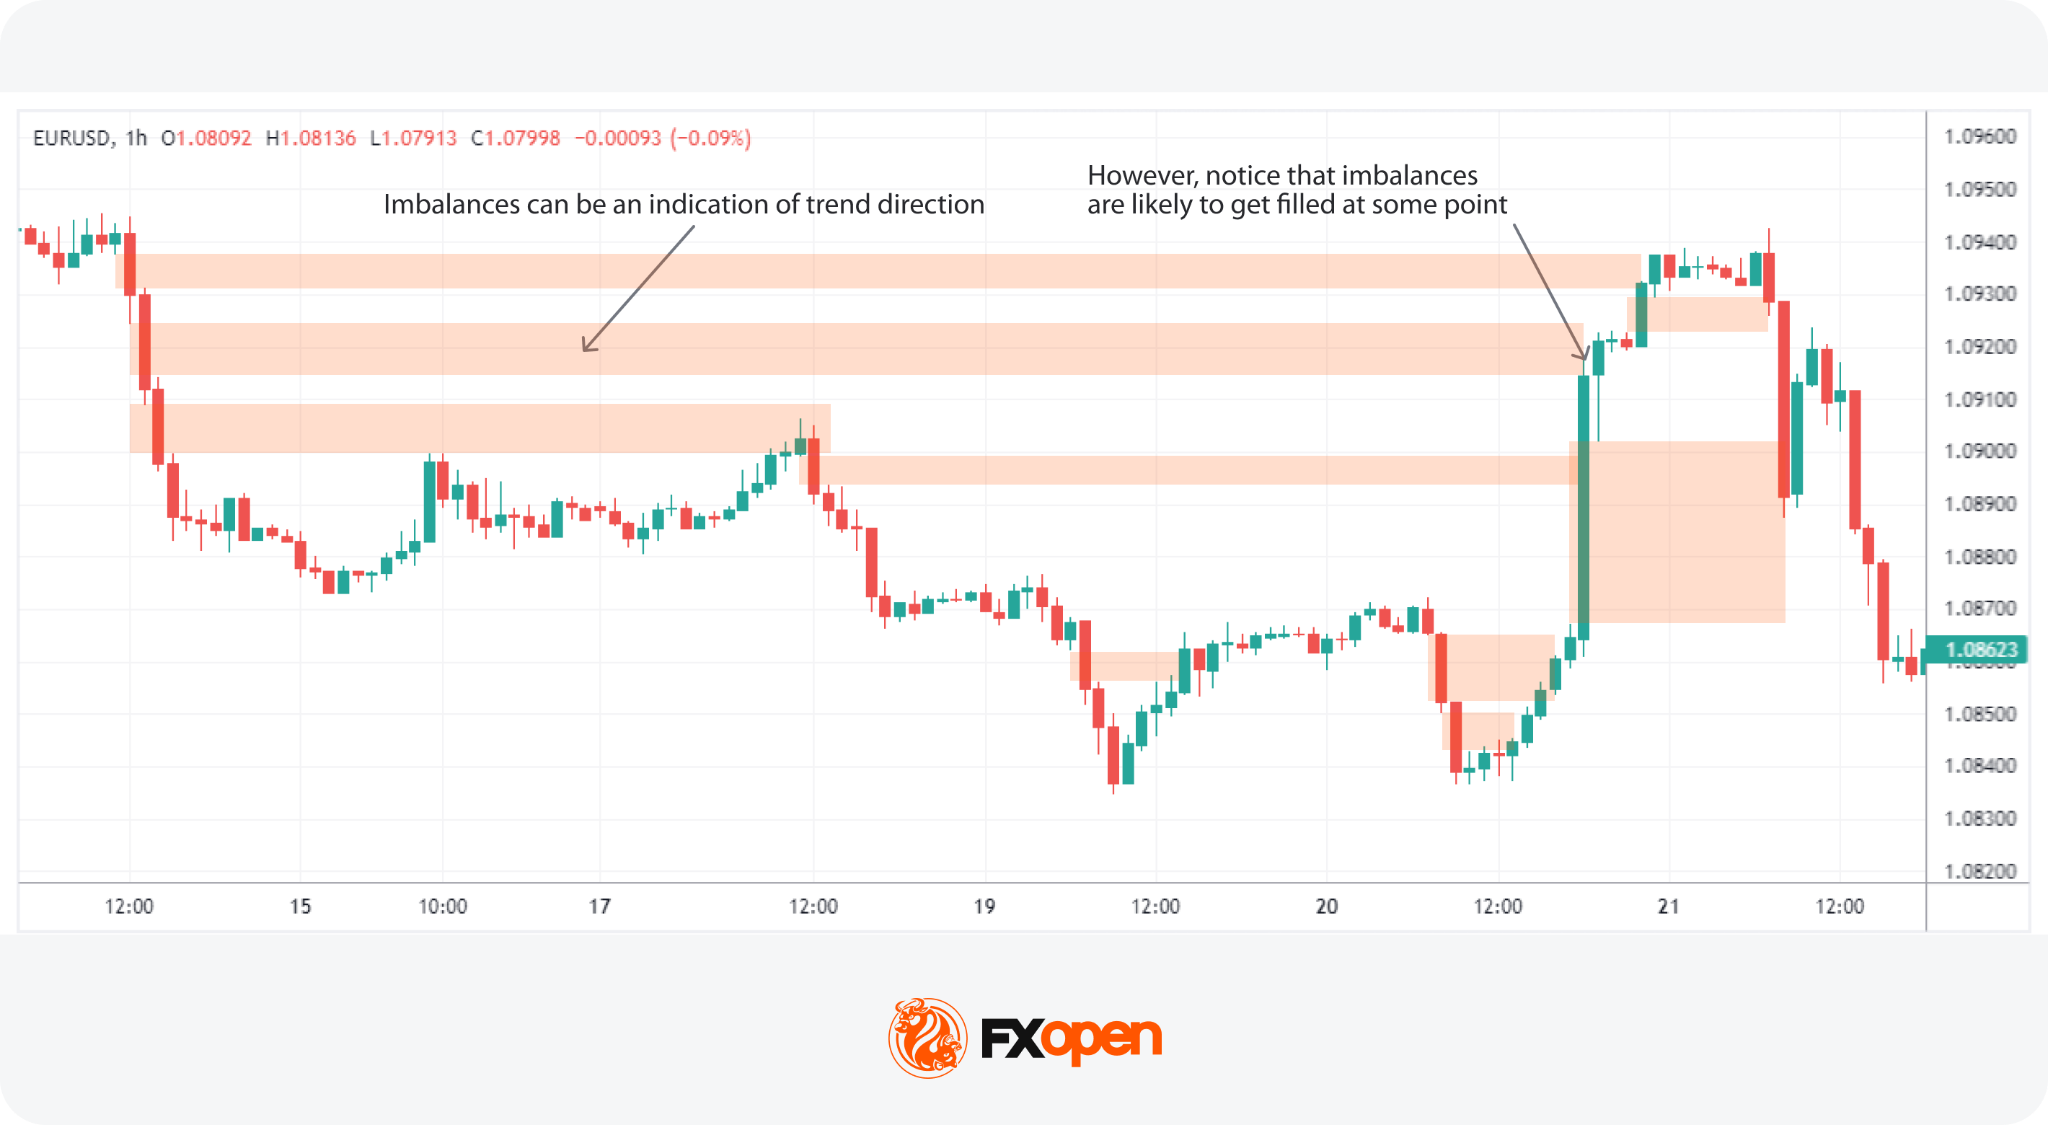
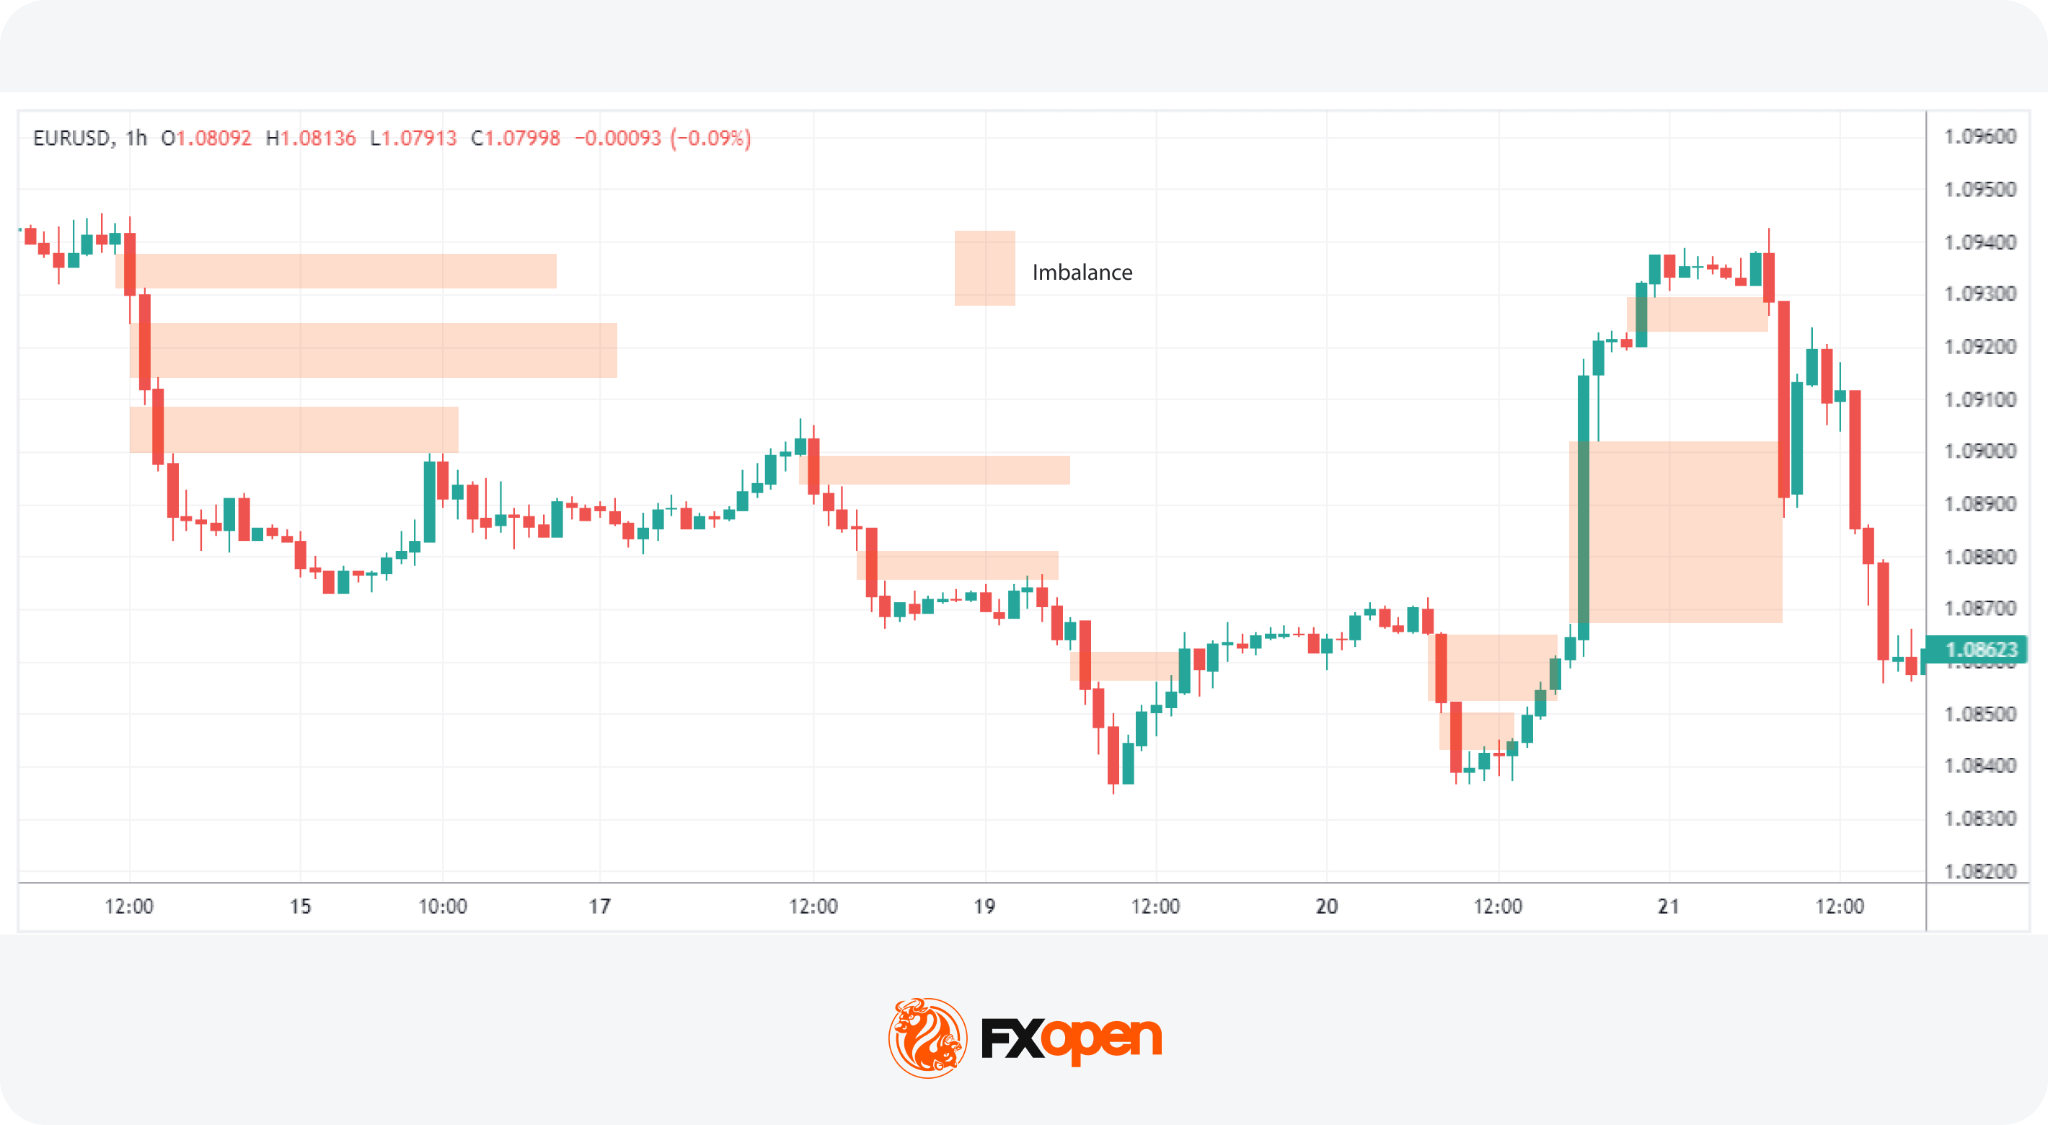
Traders often use imbalances to gauge market sentiment and direction. Large imbalances indicate a pronounced market preference for either buying or selling, suggesting that the trend in the direction of the imbalance is likely to persist. This directional insight is particularly potent with substantial imbalances (also known as liquidity voids), whereas smaller ones may be less useful for market analysis.
Markets tend to "fill" imbalance gaps, created by a lack of trading volume in a price range. This phenomenon hinges on the idea that prices gravitate towards areas of minimal resistance.
Price often returns to fill them, but some remain unfilled for weeks, months, or indefinitely, especially when tied to fundamental repricing events.
Three main reasons traders track imbalances:
Imbalances offer probability, not certainty.
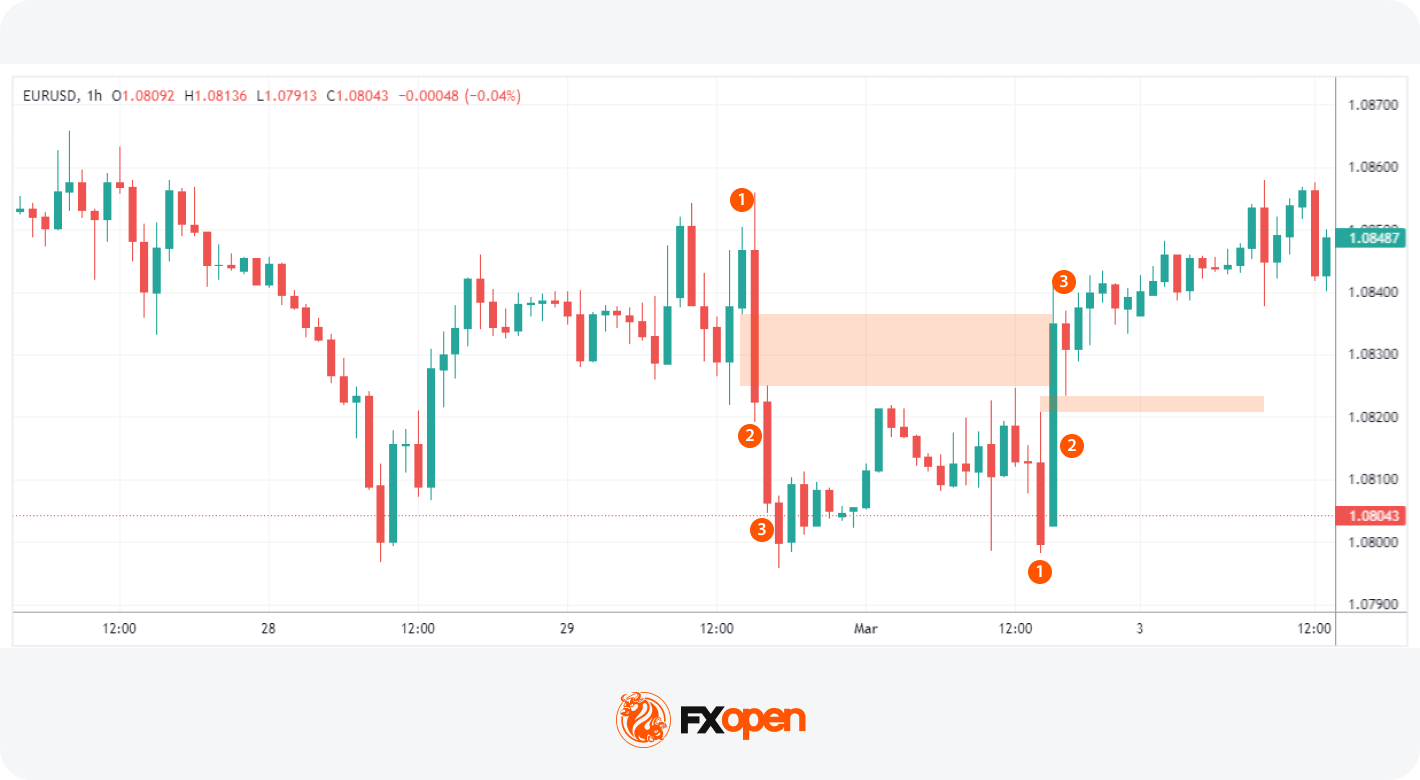
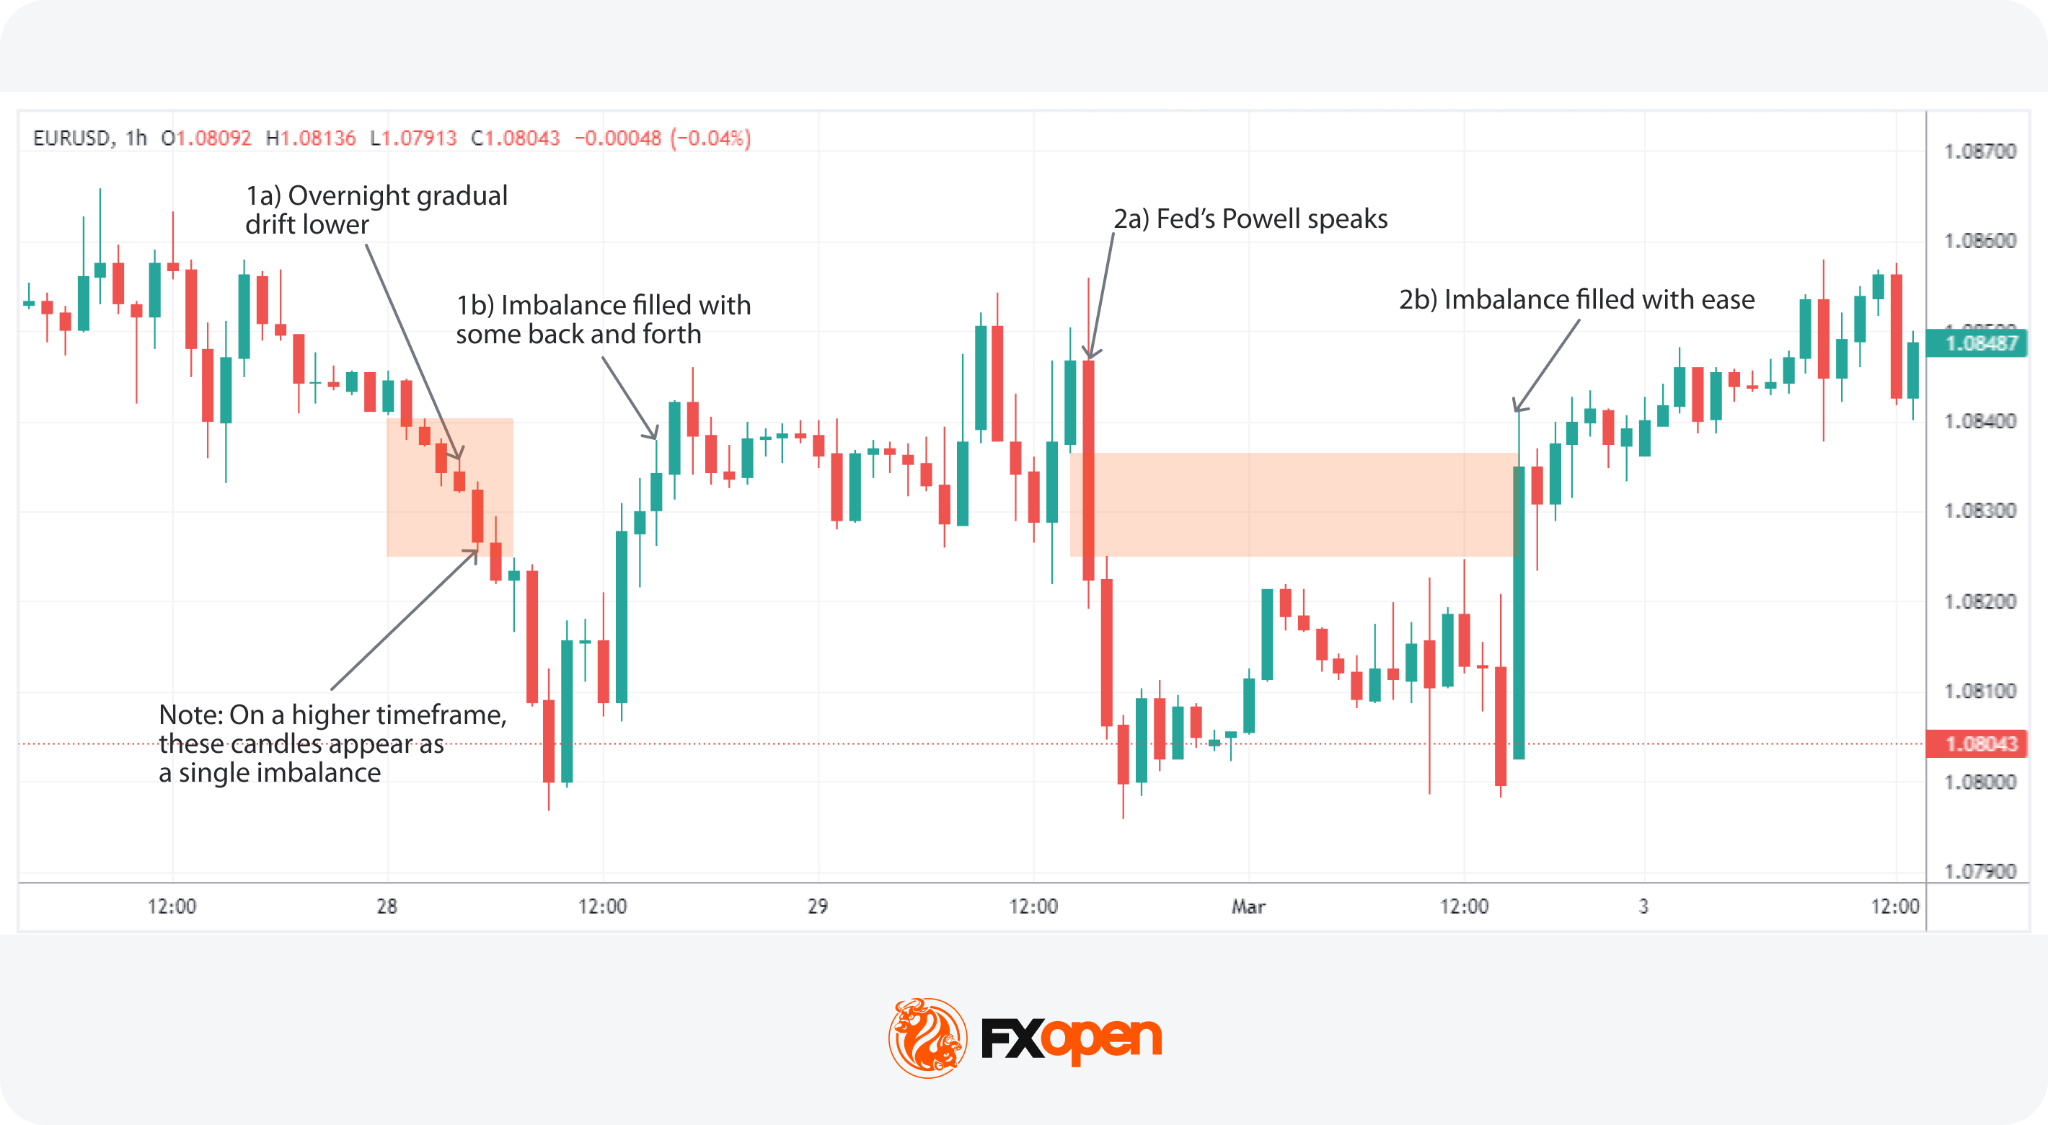
How to identify imbalance in forex and CFD charts? In imbalance trading, traders look for areas where price moved rapidly with limited opposing activity. These conditions often reflect aggressive order flow entering the market while available liquidity on the opposite side remains limited. Fair value gaps (FVGs) are among the most common visual representations of imbalance on a forex or CFD chart.
A fair value gap is typically identified through a three-candle pattern. The central candle represents a strong impulsive move, while the candles before and after it create the boundaries of the imbalance zone. Once the third candle closes, the pattern may indicate that price moved through the area too quickly to establish balanced trading activity.
Strong displacement candles are often associated with meaningful imbalances. Common visual characteristics include:
The stronger the displacement, the more significant the imbalance is often considered.
Imbalances may also appear as thin trading or low-interaction zones rather than textbook FVG structures. These areas often show limited candle overlap and minimal back-and-forth price action, indicating that the market moved rapidly through the zone.
A common process for identifying imbalance includes:
Timeframe hierarchy also matters. Imbalances that remain visible across both higher and lower timeframes are often considered more significant than those appearing only on lower charts. A daily imbalance may therefore carry more weight than a similar formation on a 5-minute chart. Higher-timeframe imbalance zones are often used as the primary reference area, while lower-timeframe imbalances may help refine entries.
An imbalance trading strategy combines trend direction, structure, and zone identification into a repeatable framework. According to theory, in an imbalance trading strategy, traders stick with the prevailing market trend. By combining trend analysis with imbalance identification, traders can align themselves with the market's momentum and identify valuable setups.
The Smart Money imbalance framework runs in four steps:
Consider following along on live charts in FXOpen’s TickTrader platform for the deepest understanding.
Some conditions reduce the reliability of imbalance trading setups:
Imbalance setups offer structure, but they carry the same downsides as any pattern-based approach. Three areas warrant particular attention.
Defining clear entry, stop, and invalidation rules before the trade may support consistency. Risk management may potentially reduce reliance on any single signal when combined with broader structural analysis
Imbalances and liquidity are linked mechanically. An imbalance forms precisely because liquidity on one side of the order book runs thin, allowing aggressive buying or selling to push price through several levels without resistance.
Imbalance | Liquidity |
The visible result on the chart: a gap or thin zone | The underlying market depth: resting buy and sell orders |
Created when liquidity is consumed faster than it is replenished | Concentrated around prior highs, lows, and round numbers |
Acts as a magnet for retracement | Acts as a fuel source for directional moves |
When aggressive buying or selling outpaces available counterparties at a price level, rapid repricing follows. This is the order flow imbalance in action, and it leaves the visible footprint traders mark as a fair value gap or liquidity void.
Imbalances in forex and CFDs are driven by four main forces: news shocks, institutional flow, sentiment shifts, and technical triggers. Each one shifts the order book in a distinct way, and the order flow impact behind each helps explain why the visible gap forms on the chart. Academic work on market microstructure, including the Bank for International Settlements paper on market liquidity, examines how these forces interact at the deepest level.
High-impact news releases and economic events can quickly skew the balance as traders react en masse to new information, either flooding the market with buy orders or triggering a sell-off. Central bank decisions, inflation prints, and employment data are among the most common triggers. The order flow impact is immediate: liquidity providers widen spreads or pull resting orders, and price gaps to a new level.
Due to their sheer volume, large institutional orders create imbalances by outpacing the market's ability to absorb them, sharply moving prices in one direction. The order flow impact here is more deliberate. A fund executing a sizable trade may break the order across price levels, but the cumulative pressure still consumes resting liquidity and leaves a visible imbalance behind.
Shifts in market sentiment, driven by broader economic indicators or trending market narratives, can collectively tilt trading activity towards buying or selling, further contributing to order flow imbalance. The shift is often gradual rather than sudden, but the cumulative result still drives one side of the book to dominate.
Technical factors, like prices reaching critical support or resistance levels, can activate automated trading algorithms that rapidly buy or sell, exacerbating the imbalance as these systems execute large-scale trades based on pre-set conditions. The order flow impact tends to be self-reinforcing: a breakout triggers more algorithmic activity, which extends the move and deepens the imbalance.
Order imbalances can serve as an indicator of market sentiment, helping traders recognise when supply and demand are not synchronised. By learning how to identify these situations and incorporating them into a structured trading approach, traders may spot potential price moves before they unfold. As with any strategy, combining order imbalance analysis with risk management and other technical tools can support traders when making trading decisions and provide a more balanced view of the market.
If you seek to apply these concepts in real-world scenarios, you can consider opening an FXOpen account, which offers trading with tight spreads and low commissions.
In trading, an imbalance refers to a situation where buy orders significantly outnumber sell orders, or vice versa, leading to potential shifts in asset prices. This disproportion indicates strong market sentiment towards either buying or selling, impacting price movement direction.
Trade imbalances are primarily caused by significant news releases, large institutional orders, shifts in market sentiment, and technical triggers. These factors can lead to a sudden surge in buying or selling activity, creating an imbalance between supply and demand.
An imbalance zone is a specific area on a trading chart where the price has moved sharply, creating a gap known as a fair value gap. This gap signifies a period during which trading volume was minimal, suggesting a potential area for price to return to in the future.
The order imbalance-based strategy involves identifying moments when buy or sell orders dominate and using this information to anticipate future price movements. Traders use these imbalances to inform their entry and exit points.
A fair value gap refers to a price area skipped over during rapid market movement, indicating a potential return point for the price. Volume imbalance, however, specifically relates to the difference in volume between buy and sell orders, impacting price direction without necessarily creating a visual gap on the chart.
A fair value gap (FVG) is a three-candle pattern where the wicks of the outer two candles fail to overlap, leaving a gap between them. It is one specific form of imbalance and often appears during sharp directional moves. Traders watch FVGs as zones may be revisited before continuing the prevailing trend.
No, price does not always return to an imbalance. Many imbalances are filled within hours, days, or weeks, but some remain open indefinitely, particularly those tied to fundamental repricing events such as central bank decisions or major economic shifts. Traders treat imbalance fills as probable rather than guaranteed and combine them with broader structural analysis.
An imbalance is the visible gap or thin zone left after a strong directional move. An order block is the last opposing candle before that move, where institutional orders are thought to have been placed. The order block is the cause, the imbalance is the effect. Traders often look for both elements to align before entering.
Imbalance is commonly identified through strong displacement candles, fair value gaps, or areas with limited candle overlap. Traders often look for rapid directional movement, breakout conditions, and low-interaction price zones that suggest the market moved too quickly to establish balanced trading activity.
Imbalance trading is applied across all timeframes, from 1-minute charts up to the weekly. Higher timeframes such as 4-hour, daily, and weekly tend to produce stronger imbalances. Lower timeframes are typically used for entry refinement once a higher-timeframe imbalance has been located. Multi-timeframe analysis sits at the core of the approach.
*Important: At FXOpen UK, Cryptocurrency trading via CFDs is only available to our Professional clients. They are not available for trading by Retail clients. To find out more information about how this may affect you, please get in touch with our team.

