
The butterfly pattern is one of the most recognised harmonic formations in technical analysis. Built around Fibonacci ratios, it provides traders with a structured way to spot potential market reversals. Unlike some patterns that complete within an initial price swing, the butterfly extends beyond it, often marking areas of exhaustion.
This article breaks down the idea and application of the butterfly pattern in trading, explaining its structure, uses, strengths, and how it compares with related patterns.
The butterfly pattern is a harmonic reversal pattern built around Fibonacci measurements. Traders look for it when price forms a specific four-leg sequence, labelled X-A, A-B, B-C, and C-D. Unlike some harmonic patterns that complete within the original range, the butterfly extends beyond the starting point, making it distinct.
The pattern was first identified by Bryce Gilmore and later popularised by Scott Carney, who detailed the precise Fibonacci ratios that define it. Because the butterfly depends on exact Fibonacci relationships, it provides a structured framework rather than guesswork. Still, it is usually combined with other forms of analysis, since the market doesn’t always respect ratios in isolation.
There are both bullish and bearish versions. A bullish butterfly forms at the end of a downtrend, while a bearish one appears at the end of an uptrend. In both cases, traders watch the “D” point closely, as this is where reversals often start if the pattern is valid.
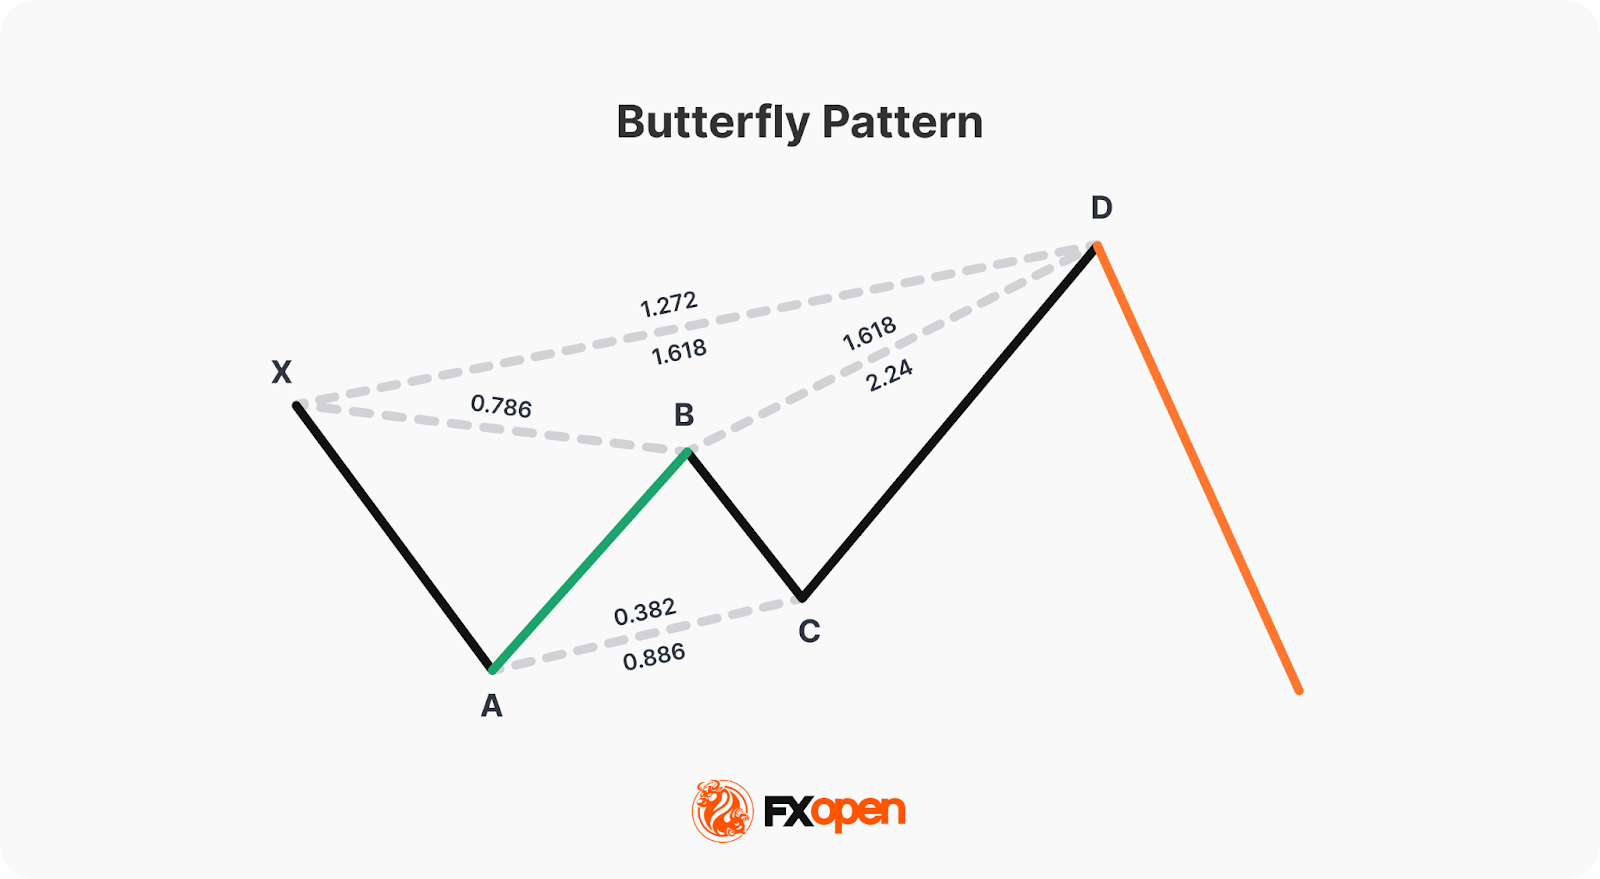
The butterfly chart pattern follows a strict structure built on Fibonacci ratios. Each leg has clear measurements, and without them, the pattern isn’t valid. Here’s how it breaks down:
Why does D matter? D is the potential reversal zone. If price reaches this level while respecting the ratios, traders view it as a high-probability area for the trend to turn.
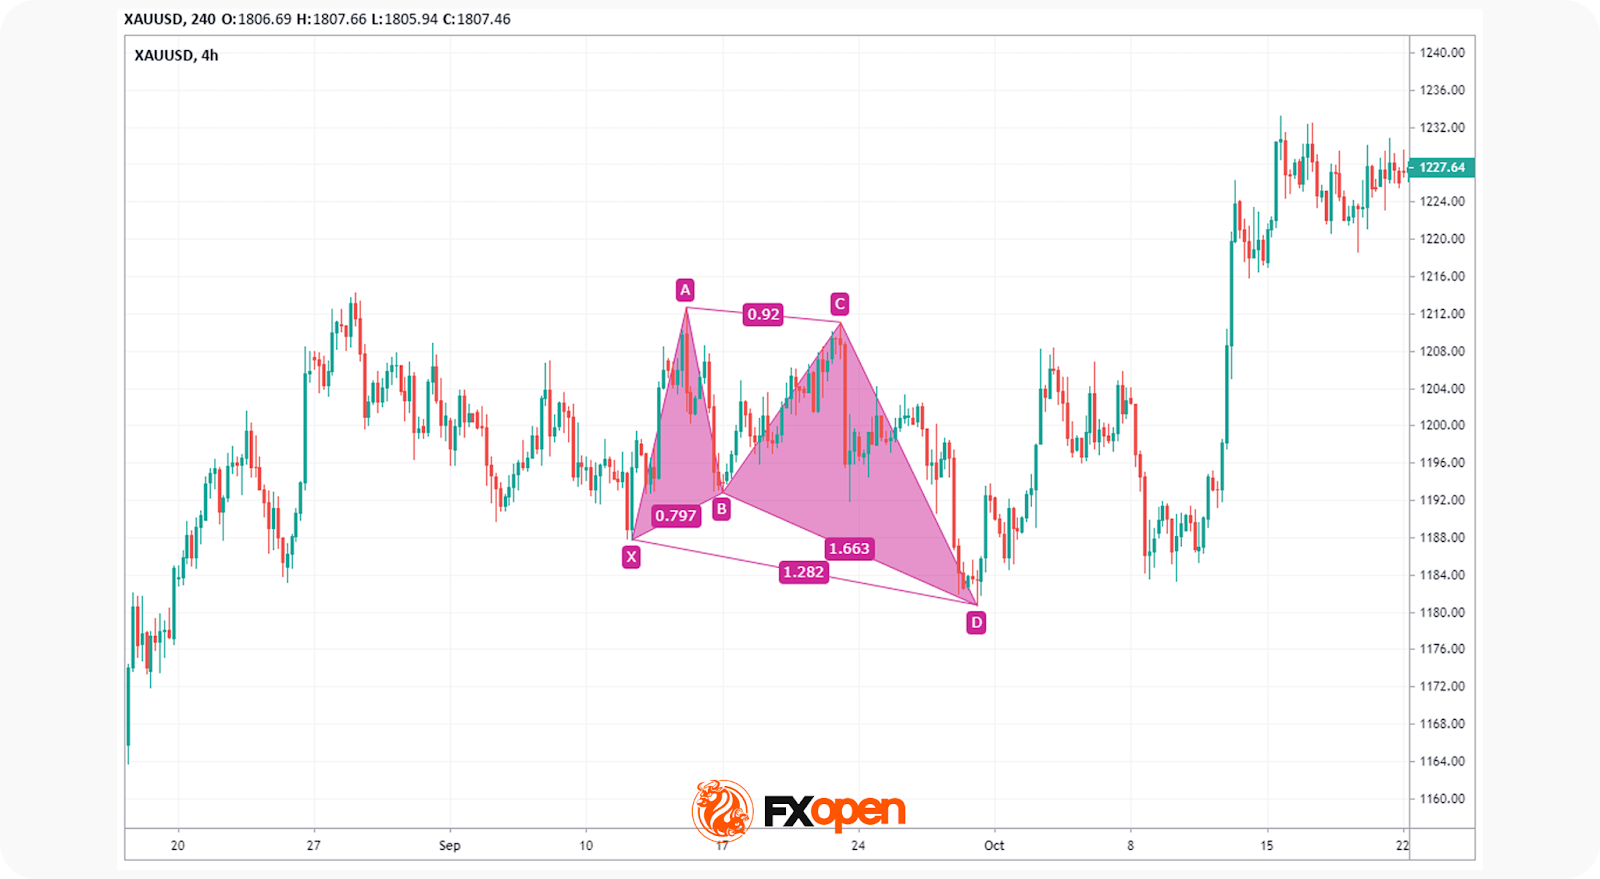
Valid harmonic butterflies often look balanced. Uneven swings or distorted legs usually reduce reliability, since the pattern depends on measured ratios and visual harmony. You may consider using these rules to identify the butterfly pattern in stock, forex, and commodity CFD markets with FXOpen’s TickTrader platform.
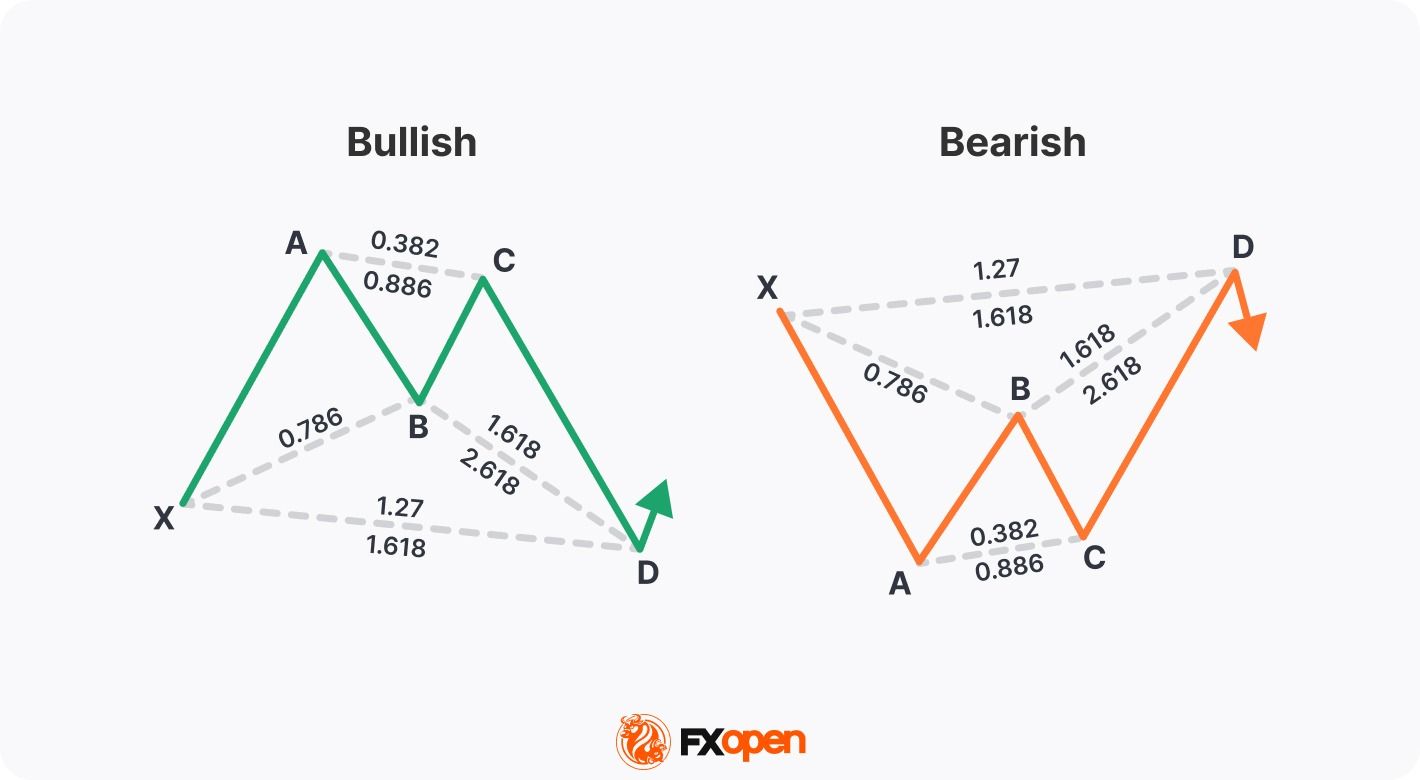
The butterfly pattern appears in two forms, depending on market direction:
The structure is the same in both cases—the key difference is whether the setup points to exhaustion at the highs or at the lows.
Accuracy is critical with the harmonic butterfly pattern, since even small mistakes in measurement can make the setup invalid. Traders typically follow these steps to use the butterfly pattern in a trading strategy:
The general butterfly harmonic pattern rules are:
Bearish | Bullish | |
Entry Point | Point D | Point D |
Take Profit | The theory suggests a trader places a take-profit order at the A/C point (aggressive approach) or B (defensive approach). Also, it would be possible to partially take potential profit at 61.8% and 127.2% of the CD leg. | The theory suggests a trader places a take-profit order at the A/C point (aggressive approach) or B (defensive approach). Also, it would be possible to partially take potential profit at 61.8% and 127.2% of the CD leg. |
Stop Loss | Traders could consider setting a stop loss beyond a certain extension of the XA or the AB lines that would invalidate the pattern, e.g. a 190% extension of XA or a 290% extension of AB. | Traders could consider setting a stop loss beyond a certain extension of the XA or the AB lines that would invalidate the pattern, e.g. a 190% extension of XA or a 290% extension of AB. |
The butterfly trading pattern gives structure to spotting potential turning points, but traders rarely treat it in isolation. Its value comes from combining the ratios with broader market context. Here’s how it’s typically applied:
The pattern is only considered complete when price reaches the projected D zone. Traders monitor this level closely, since it aligns with Fibonacci extensions that often mark exhaustion. Importantly, D isn’t a guaranteed reversal—it’s a zone worth watching.
2. Using confluence.
Traders often strengthen the analysis by looking for other signals lining up near point D. For example, if D overlaps with a long-term support or resistance level, round number, or a moving average cluster, the reversal gains weight. Confluence adds context to the Fibonacci levels.
3. Watching market behaviour.
Once price approaches D, the focus shifts to how the market reacts. A sharp rejection, slowing momentum, or confirming candlestick pattern gives traders more confidence that the butterfly is playing out. Without some form of reaction, many will consider the pattern incomplete or unreliable.
4. Aligning with broader analysis.
The butterfly is often cross-checked with trend analysis or higher timeframe structures. For example, spotting a bearish butterfly near a monthly resistance zone may be treated differently than one forming mid-trend with no context.
Like any technical formation, the butterfly pattern has advantages and drawbacks. Understanding both sides makes it clearer when the pattern is worth your attention and when caution is needed.
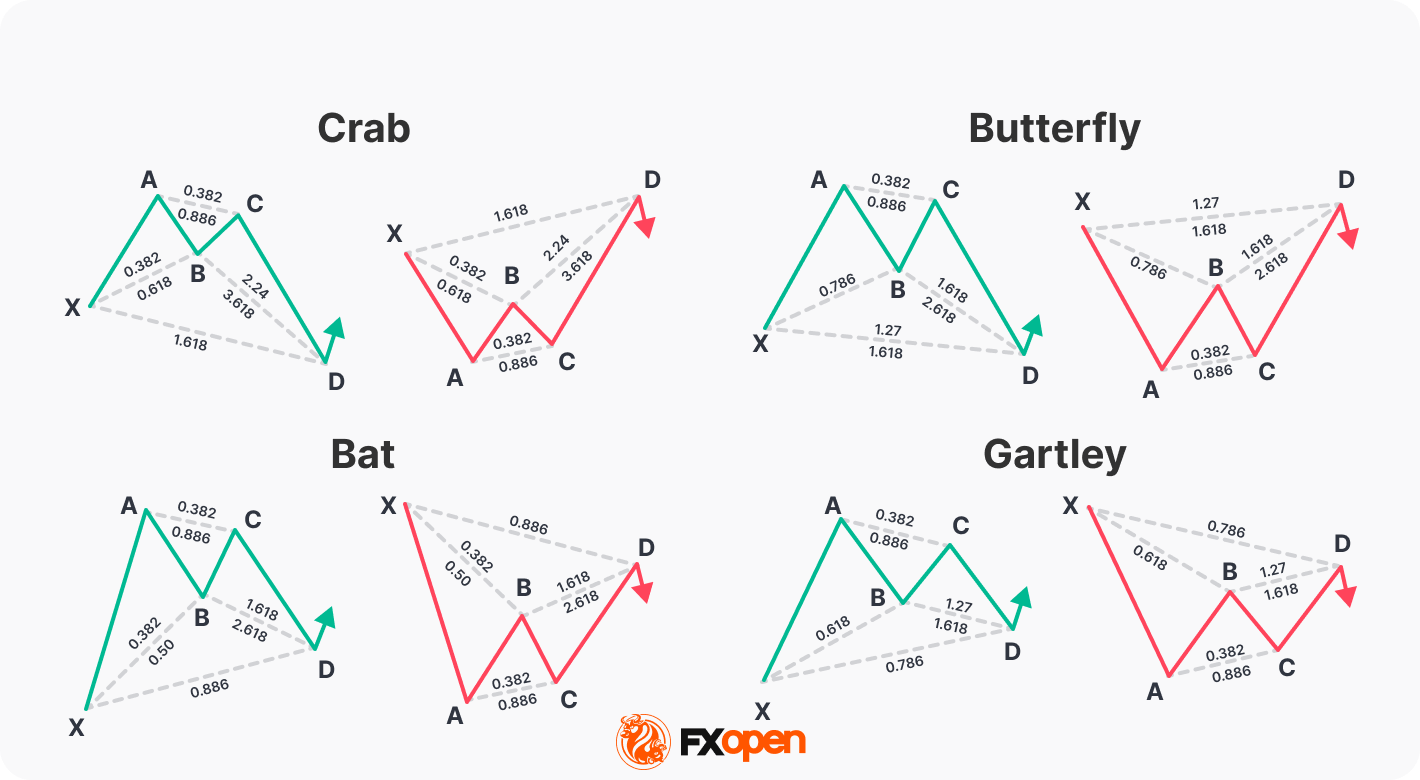
The butterfly pattern is one of several harmonic structures that traders analyse. While it shares similarities with others, there are key differences worth noting.
The Gartley is a popular harmonic pattern. Unlike the butterfly, it completes within the original XA leg. Point D usually lands around the 78.6% retracement of XA, making it a shallower structure. The butterfly, in contrast, extends beyond X, highlighting deeper exhaustion.
The bat also stays within the XA range. Its defining feature is a smaller AB retracement, typically around 38.2% to 50% of XA. This makes the Bat more compact and less extended than the butterfly, which has a larger projection and a more aggressive reversal point.
The crab looks similar to the butterfly but has a much larger extension. Point D in the crab can stretch to 224%–361.8% of BC, far beyond the butterfly’s 161.8%–261.8% range. This makes the crab more extreme, often appearing in strongly extended markets.
In essence, the butterfly sits between the compact Gartley and bat, and the extreme crab, giving traders a structured middle ground for spotting potential reversals.
The butterfly pattern in technical analysis offers traders a structured way to analyse potential reversal zones with clear rules and measurable ratios. While it’s typically used alongside broader market analysis, its precision makes it a valuable addition to technical trading.
Those looking to apply harmonic patterns in live markets may consider opening an FXOpen account, where you can access advanced charting tools and put structured analysis like the butterfly into practice.
Butterfly trading is the practice of analysing the butterfly harmonic pattern across markets. It involves confirming Fibonacci ratios, identifying completion at point D, and monitoring price reaction. Traders use the butterfly pattern in stock markets, on forex charts, and with other assets to anticipate potential reversals, usually alongside other technical analysis tools.
The butterfly pattern is a harmonic reversal structure built on Fibonacci ratios. It features four legs—XA, AB, BC, and CD—with point D extending beyond X, highlighting potential exhaustion and signalling where a trend reversal may develop.
Traders usually watch for the butterfly to complete at point D, then look for confirmation through price reaction or candlestick patterns. Profit objectives could be set near points B and A/C, while invalidation levels are usually placed beyond point D.
No single approach fits all. The most common use typically combines the butterfly with wider market analysis. Confluence with support, resistance, or higher timeframe structures adds weight, while confirmation signals provide traders with more confidence than relying on Fibonacci ratios alone.


