Anyone watching this token closely has probably noticed the pattern: one stretch of the day it's solid green, the next it's back in the red, even when nothing bad has actually happened.
This XRP News Today roundup digs into why that happens and pairs it with two genuinely strong pieces of underlying data that tell a steadier story than the chart does.
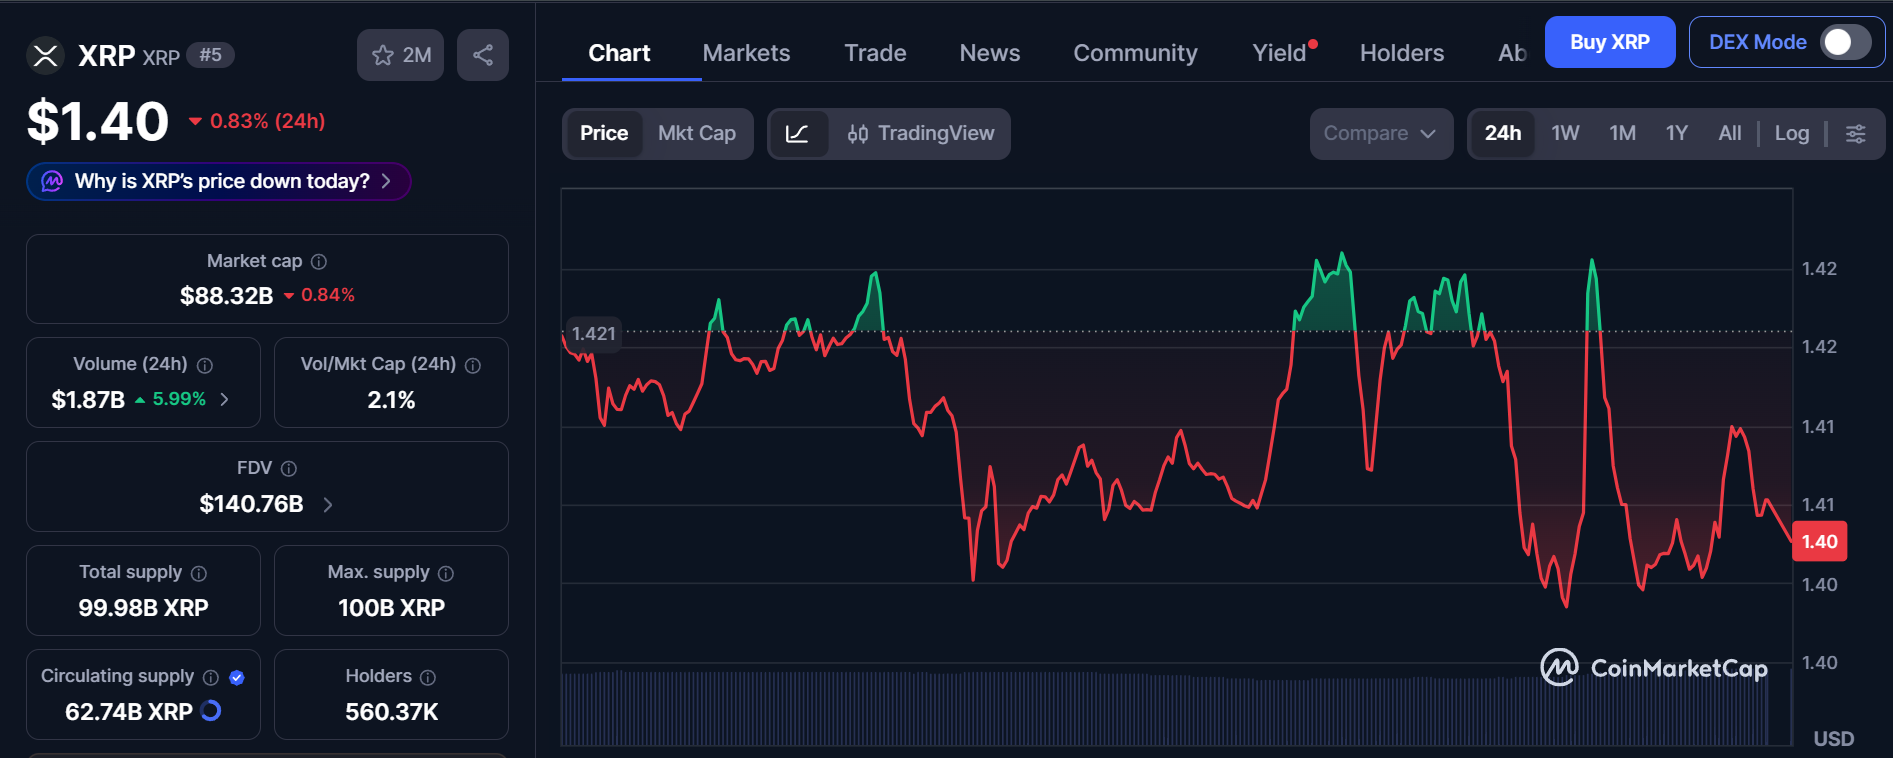
According to CoinMarketCap's live data, the token was trading at $1.40, down 0.83% over the past 24 hours, after swinging between roughly $1.40 and $1.42 multiple times in a single session.
Metric | Value |
Price | $1.40 |
24h Change | -0.83% |
Market Cap | $88.32B |
FDV | $140.76B |
24h Volume | $1.87B (+5.99%) |
Note: Cryptocurrency prices can change rapidly. Price data may differ from the latest market value, so always verify the current price through an official or reliable market source before making any financial decision.
Source: CoinMarketCap's live data
Volume actually rose slightly even as price dipped, a sign that this back-and-forth pattern is being driven by real trading activity rather than a market that's simply gone quiet.
Understanding this pattern is central to today's XRP News Today story.
The honest answer is that this kind of choppiness isn't unusual for large-cap asset trading through short-term momentum shifts.
A handful of mechanical reasons tend to explain it:
With tens of billions of dollars in daily volume moving through a token still priced under $2, even modest dollar-value swings translate into larger-looking percentage moves.
Short-term traders using leverage can amplify small moves in either direction, triggering cascades of automatic buying or selling once certain price levels are hit.
Because this asset trades continuously across global exchanges, momentum can shift quickly as different regions' trading desks come online and go offline throughout the day.
None of that is unique to this token, but it does help explain why a single day can look dramatically green in one chart window and dramatically red in the next, even without any real news driving it.
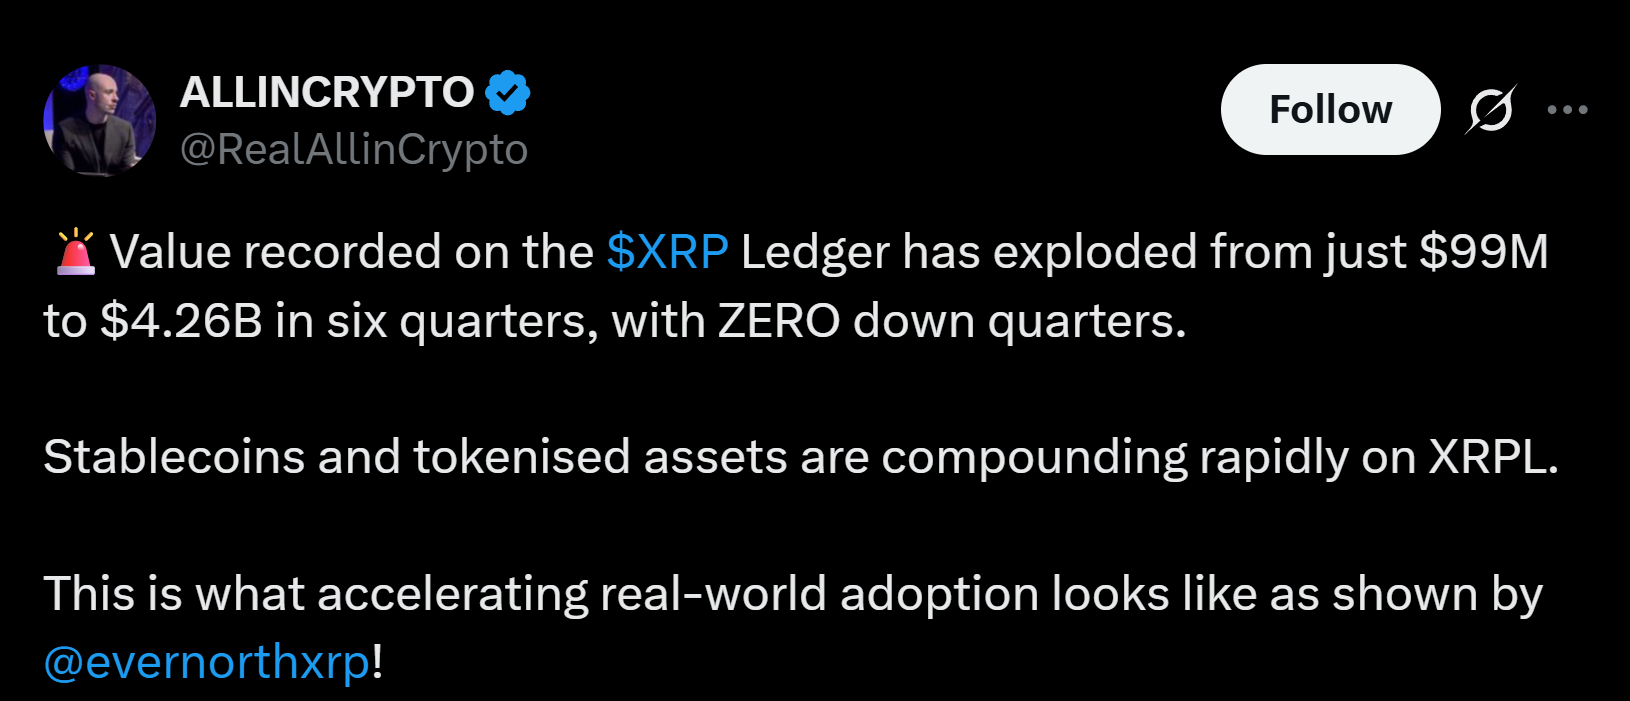
Away from the minute-to-minute price action, a report published by Evernorth on September 2 paints a much calmer picture of what's actually happening underneath.
Source: RealAllionzCrypto on X
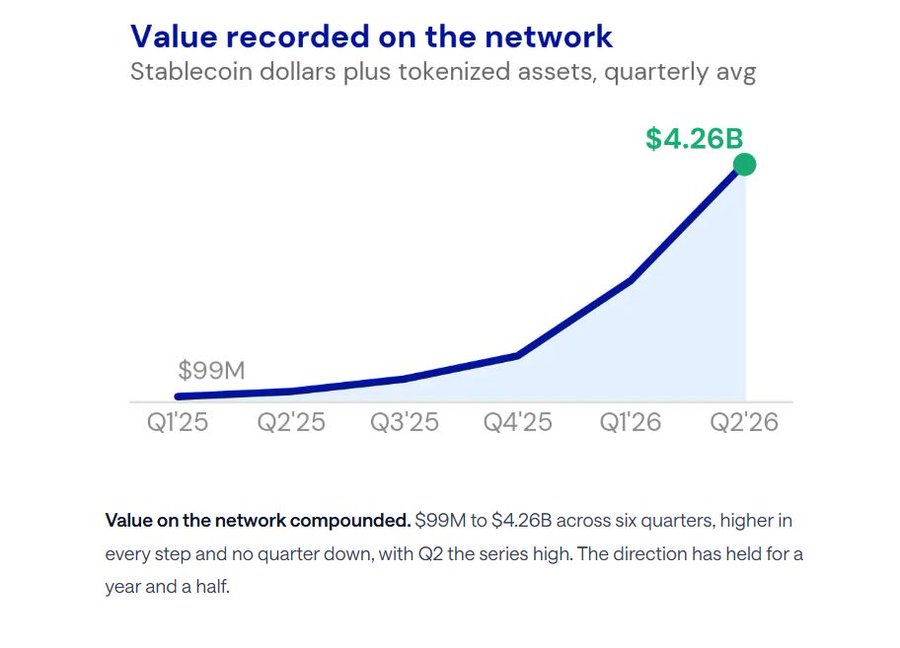
According to the report, total value recorded on the ledger, combining stablecoin balances and tokenized assets, grew from $99 million to $4.26 billion across six straight quarters, with not a single quarter posting a decline.
A few additional details stand out from that same report:
Ripple's own dollar-pegged stablecoin balances averaged $539 million in the most recent quarter, up from just $73 million a year earlier.
Order-book trading volume on the ledger's exchange reached 3.57 million XRP per day, up 79% year over year.
US spot ETFs tracking this token brought in $273 million over the quarter, with every single month landing positive.
That kind of steady, compounding growth in underlying usage is a very different signal than day-to-day price swings, and it's the type of data that tends to matter more over a year than over a single afternoon.
A separate, verified data point rounds out today's XRP News Today picture.
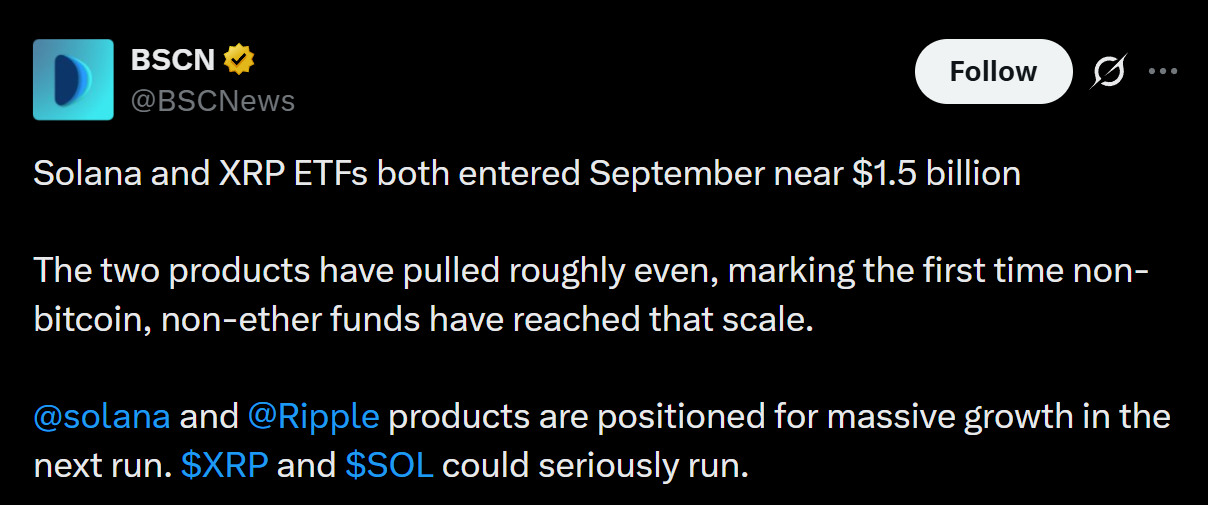
Spot ETFs tracking this token and Solana's own ETFs both entered September holding assets near $1.5 billion, marking the first time either of these two non-Bitcoin, non-Ether products has reached that scale.
Source: From BSCNews
None of this guarantees smoother price action ahead, and this isn't a forecast. But when short-term charts stay choppy while stablecoin balances, ETF assets, and on-ledger trading volume all keep climbing in a straight line, that combination usually reflects a market still finding its footing on price discovery, not a project losing underlying support.
The gap between the two pictures, the volatile chart versus the steady fundamentals, is often where longer-term investors find their entry points.
This edition of XRP News Today explains the choppiness that's frustrated plenty of traders watching this token flip between red and green, while also showing that the numbers underneath the chart, network value, stablecoin growth, and ETF assets, have moved in a much steadier direction.
Whether that steadier trend eventually smooths out the price itself is something worth watching in the weeks ahead rather than assuming.
This content covers financial markets and is for general information only. It is not financial, investment, trading, or legal advice. Crypto assets are volatile and can lose value fast. Always do your own research. Speak with a licensed financial advisor before making investment decisions.





