Zcash flashes a TD Sequential buy signal near $551. Analysts eye $642 if $500 holds. Here is what the charts show right now.
A key technical indicator is flashing a buy signal on Zcash (ZEC).
Crypto analyst Ali Charts spotted a TD Sequential 9 buy signal on the 12-hour chart near $551. The signal points to possible trend exhaustion after recent selling pressure.
Ali Charts noted that a move toward $642 remains possible as long as $500 holds as support. ZEC started off June trading around $542 to $567, following a sharp multi-month rally.
Read also:
ZEC Nears Critical $700 Zone as Traders Spot November Repeat
ZEC has gone through three clear phases in 2026. From January through March, price dropped from roughly $500 down toward the $200 region.
April brought a period of accumulation, with price stabilizing between $220 and $280. Then in May, ZEC broke out explosively, pushing above $600 before pulling back into consolidation.
That rally from around $220 to $690 represents a gain of over 200%. This explains why price is now cooling rather than pushing higher. The broader narrative driving ZEC includes privacy technology adoption, institutional inflows, and shielded transaction growth.
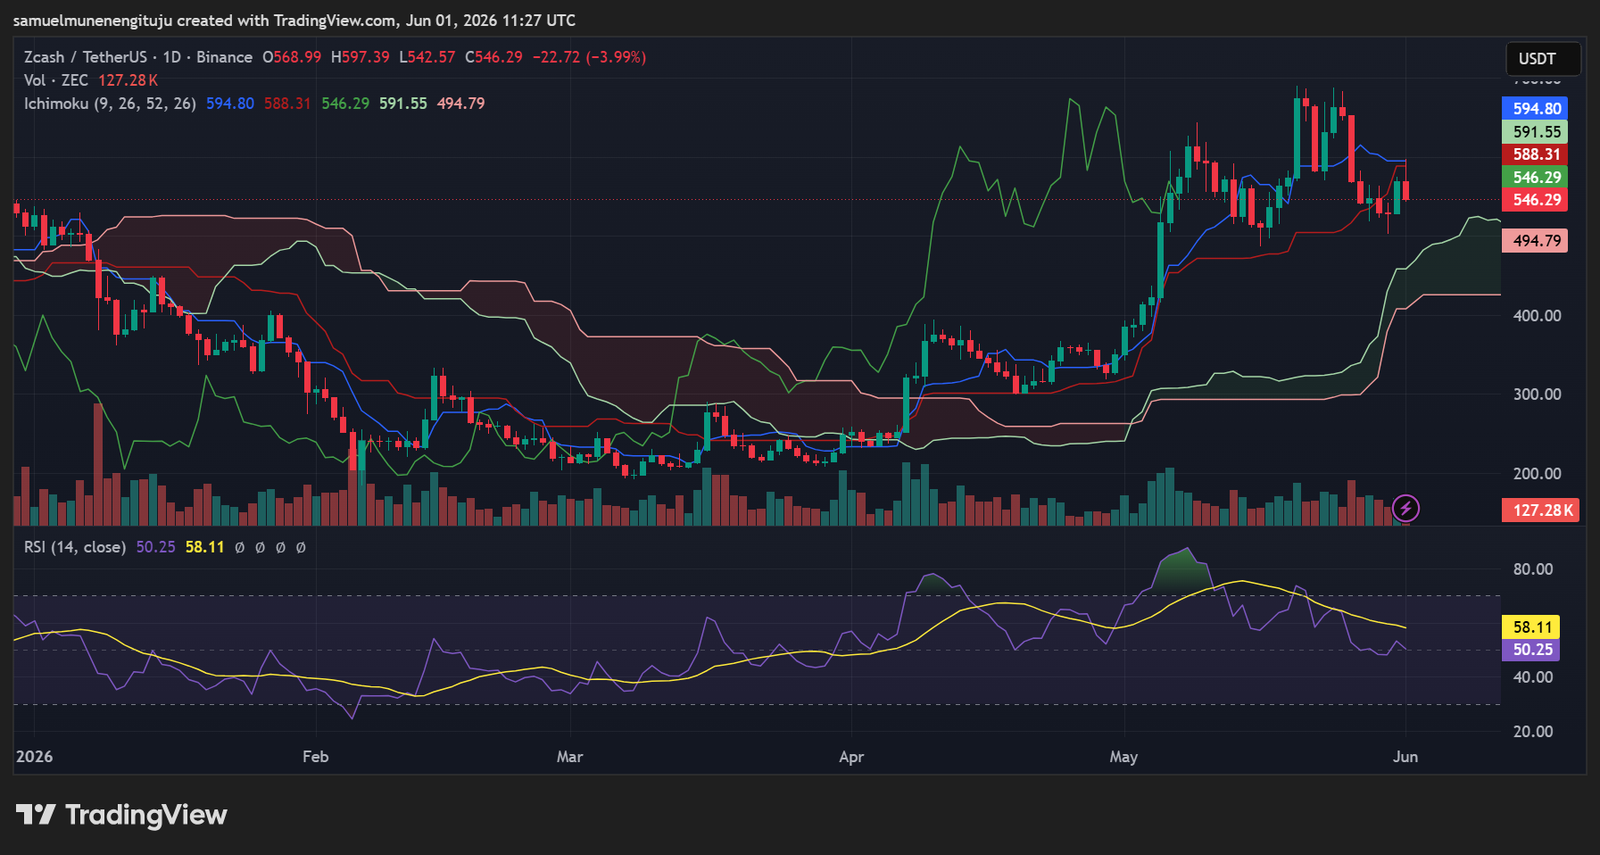
The daily chart shows ZEC closing at $546.29, down 3.99% at the time of analysis.
Despite the red candle, price holds above the Ichimoku cloud and key breakout support zones. The larger bullish structure remains intact on the daily timeframe.
The TD Sequential is flashing a buy signal on Zcash $ZEC.
I believe a move toward $642 remains possible while $500 holds. pic.twitter.com/oBvxJ03ujj
— Ali Charts (@alicharts) June 1, 2026
The Ichimoku readings tell a mixed story. The Tenkan-sen sits at 594.80 and the Kijun-sen at 588.31. Price trading below both lines signals short-term momentum deterioration.
However, the future cloud remains green, rising sharply, with Span A above Span B. These are classic bullish trend characteristics.
The RSI reinforces this picture. It currently reads 50.25, well below the signal average of 58.11. RSI exceeded 70 earlier in May, reflecting an overheated market.
Now it sits near neutral, meaning excess bullish pressure has eased. There is still room for further consolidation before buyers step back in.
Volume also supports a consolidation reading rather than a reversal. Volume surged during the May breakout but has since declined gradually.
Recent selling volume stays moderate, which analysts say does not indicate aggressive institutional distribution.
The most critical zone right now is $540 to $550. Buyers defending this area could trigger a rebound toward $590.
Below that, $495 aligns with the lower cloud boundary and Senkou Span B. A drop to that level would still keep the overall bullish structure intact.
If $540 breaks, the next targets shift to $520, then $495, and possibly $470 to $450.
A daily close below the cloud would signal that the correction is deepening. That scenario would shift momentum in favor of sellers.
On the upside, the first resistance sits between $590 and $600. This zone holds the Tenkan-sen, recent swing highs, and psychological resistance.
Reclaiming that area would restore strong bullish momentum. Beyond that, $650 to $690 marks the recent peak zone. A daily close above $700 would confirm continuation of the larger trend.
The post Zcash Key Indicator Flashes Buy Signal: ZEC Price Analysis appeared first on Live Bitcoin News.

